
Commentary provided by Dr. Richard Sheehan, Economist
This quarter I want to take a more detailed look at monetary policy and what the Federal Reserve is attempting to do with a particular focus on inflation. The Fed’s objective is often labeled a dual mandate, focusing on both a low unemployment rate and a low inflation rate. Their charge: maximum sustainable employment consistent with price stability or non-accelerating inflation. We generally think of the process as generating an unemployment rate consistent with full employment and a rate of change in prices that is below some level. Unfortunately, both for policymakers and for the general public, neither term is precisely defined, and there is disagreement on what are the appropriate target values for unemployment and inflation.
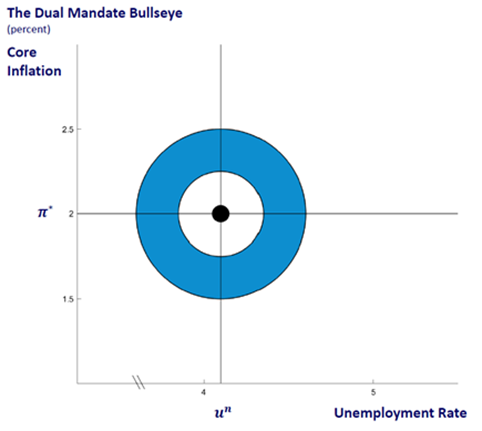
The Chicago Fed presented a diagram indicating the core inflation rate and the unemployment rate reflecting the two components of the mandate. Figure 1. Their diagram, below, presents a blue bullseye around the target values of 2% inflation and about 4.1% unemployment and a “blue” range from 1.5-2.5% for inflation and 3.6-4.6% for the unemployment rate. It should be noted, however, that there is no language about specific numeric targets in any of the instructions that Congress has given to the Fed.
Over the years macroeconomists have spent much time debating the “full employment unemployment rate” or FE-UR. That is, what is the unemployment rate when the economy is at full employment? New entrants to the labor force, individuals between jobs, and changes in the in the structure of the economy will keep FE-UR above zero. Logically, we should be at FE-UR when actual GDP equals potential GDP, but measuring potential GDP is a challenge. Economists have argued for a wide range of values for FE-UR, running from 3.5% up to 6.0%. Those debates have subsided somewhat as it becomes more obvious that there is no single number that is appropriate. The FE-UR changes over time. During the 1970’s, it may have been as high as 6.0%. Since January 2019, however, the actual unemployment rate has ranged between 3.5% and 4.0%, with the exception of the COVID-19 shock and recovery period. In the two years prior to COVID-19, the actual unemployment rate averaged 3.7%, and in the 28 months since the recovery from COVID-19 ended, the actual unemployment rate averaged 3.7%. Realistically, given the imprecision with which we can measure FE-UR, it is reasonable to argue that its range currently runs from 3.5-4.0%. Presumably, that range is the Fed’s target for the employment part of its mandate.
Determining the appropriate inflation target is even more challenging. Economists define inflation as “continuous and sustained increases in the price level above some minimal value.” That definition- differs from the lay use of the term which would include any increase, large or small, sustained or one-time, as inflation. That distinction is critical, however. Small overall price increases make it easier for firms to increase prices in the face of excess demand. One can think of small price increases as providing a lubricant for markets to perform efficiently, and economists generally conclude that small price increases are good for the economy – and certainly are better than price decreases or deflation. What is defined as “small,” however, should be understood to be relative, in particular, to recent history. For example, from 1997 until COVID-19, the rate of price increase – a term I am deliberately using instead of inflation – was 2.0%.
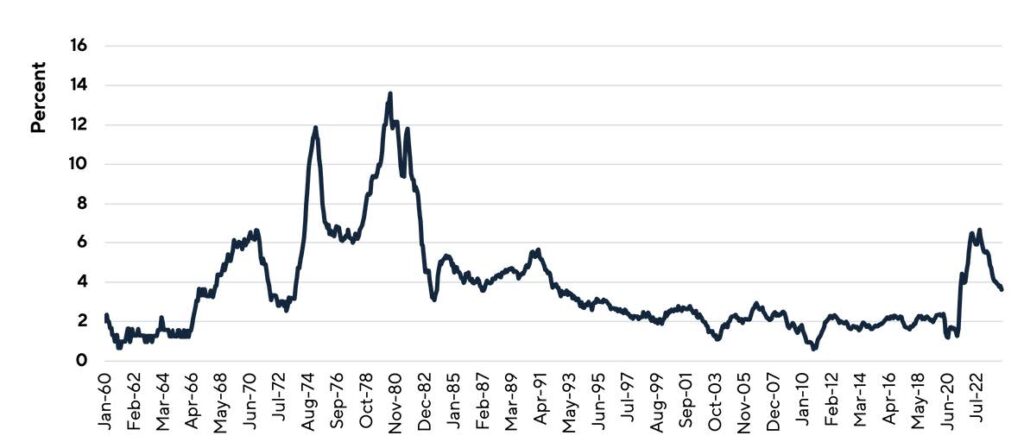
Chart 1 presents the year-over-year inflation rate going back to 1960. Hitting 6.2% for the core CPI inflation rate during 2022 represented a major shock relative to expectations. In comparison, Nixon imposed wage-price controls in August 1971 when inflation was slowly dropping at 4.9% but was still high by historical standards, e.g. 2.9% since 1960. In contrast, U.S. inflation averaged 8.6% from 1974 to 1982, and that rate falling to about 5% in 1984 was viewed as a return to price stability. Relative rates of price increases are critical even when it comes to defining what we mean by inflation.
Chart 1
My point? Just as there should be some recognition that the FE-UR target likely changes over time, the inflation target should change over time as well, at least in part reflecting changing expectations, changing market conditions, and changes in the forces that determine inflation, some of which the Fed has little to no control over.
Compounding the problem for the Fed, higher interest rates may have the effect of raising the CPI in the short-term. For example, over the past year, the overall CPI increased by 3.6% but the shelter component of CPI, amounting to 36.2% of the index, rose by 5.5%. Removing shelter, the remaining parts of the CPI increased by 2.6%, not appreciably different from the Fed’s target inflation rate. One might reasonably ask if the Interest Rate On Reserve balances (IORB) were 3.4% rather than its current 5.4%, (and the Fed funds rate was down 2% as well) would housing inflation have decreased substantially and might the overall CPI increase be close to 2.5% and thus justify further rate cuts?
I started out by considering the Fed’s so-called dual mandate, basically considering unemployment and inflation. While that short-run tradeoff is central to the Fed’s decision-making process, there is a third critical charge as well that has assumed more importance in recent years: enacting a monetary policy that is conducive to long-term growth. In general, that additional policy goal would suggest placing a greater emphasis on lower interest rates. It also suggests, however, that the term structure of the Fed’s bond holdings would change toward longer maturities driving down long-term interest rates. In 2002 almost 50% of the Fed’s Treasury holdings had a maturity of one year or less while 20% had a maturity longer than five years and only 12% had a maturity over 10 years. In contrast, currently, 18% of the Fed’s Treasury holdings have a maturity of one year or less while 48% have a maturity longer than five years and 34% have a maturity over 10 years. This shift in maturity likely at least partially explains why the Treasury term structure has changed with the 10-year rate consistently lower than the 1-year rate. An inverted yield curve historically has been interpreted as an indicator of a coming recession. The Fed’s changing focus and changing portfolio makes recession indicators much less reliable.
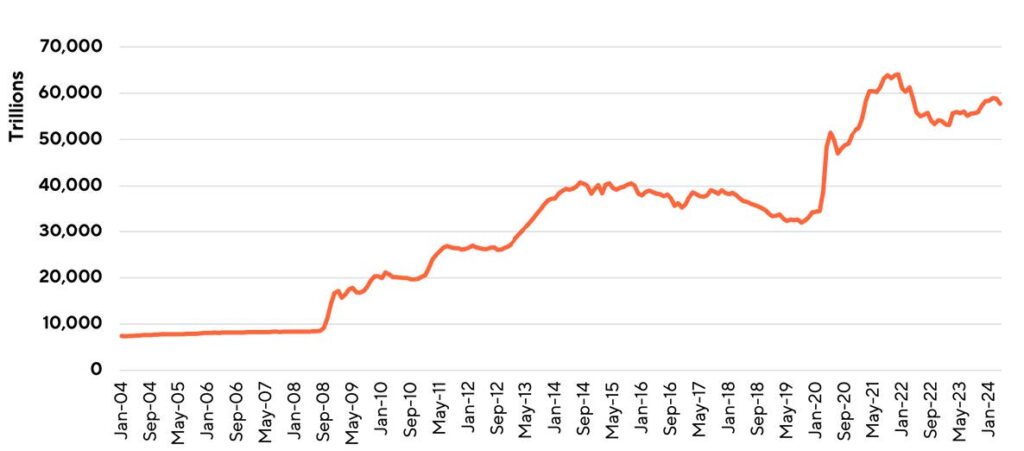
Adding growth into the unemployment/inflation mix makes interpreting prior Fed actions and likely future actions more challenging, with three items to juggle rather than two, unemployment and inflation and economic growth. And there is yet a fourth consideration in play, although not a direct charge from Congress to the Federal Reserve. The Fed’s rounds of Quantitative Easing (QE) following both the financial crisis and Covid dramatically increased the size of the Fed’s bond portfolio. The Fed has long signaled that it wanted to reduce the size of its bond holdings. From 2015 until shortly before the pandemic, that is exactly what the Fed did, generally not by selling bonds but by letting current bonds mature and disposing of them upon maturity. These actions are clear from Chart 2 which presents the monetary base over the past twenty years. Until the financial crisis, changes in the monetary base were trivially small compared to changes since then. Three rounds of QE following the financial crisis plus another two periods of QE following Covid have increased the MB by almost 500%. If circumstances permit, the Fed would like to substantially reduce the size of its bond portfolio.
Chart 2
Where do all these stressors leave the Fed? Simply stated: in a very stressful position. The Fed has publicly been self-congratulatory about using contractionary policy and generating a soft landing rather than a recession. At the same time, the Fed has cut the inflation rate roughly in half but still is faced with an inflation rate persistently above the Fed’s current target. Consider how the four goals of the Fed fit with a change in interest rates. A soft landing, together with maintaining a low unemployment rate, suggests lowering interest rates. But continuing to push towards its inflation target suggests increasing rates. Long-term growth also pushes towards lower rates. However, any effort to reduce the monetary base could lead to higher rates. Two goals push for higher rates and two for lower rates. With this background, it should not be surprising to hear different voices within the Fed presenting somewhat different perspectives on potential monetary policy actions over the next few months.
My interpretation of what is likely to come is based on two considerations. First, the Fed historically has been extremely cautious in its actions to combat both unemployment and inflation. Second, as the election draws near, the timing is only likely to make the Fed even more cautious. There are three meetings of the FOMC between now and the election. Unless there is a substantial shock, e.g. the unemployment rate rising well above 4%, it would appear unlikely that we have a rate cut before the election. It is even more unlikely that we see a rate increase. There are two FOMC meetings in the remainder of 2024, one immediately after the election. If inflation continues its excruciatingly slow decline, it would not be surprising to see a rate cut at one of those two meetings. More than one rate cut and any rate increase both appear to be very low probability events given current data and absent any serious economic shock. While there is an unusually large amount of uncertainty in multiple dimensions, e.g. unemployment and inflation, perhaps paradoxically these offsetting uncertainties make it less likely to see any monetary policy surprises at least in the short term.
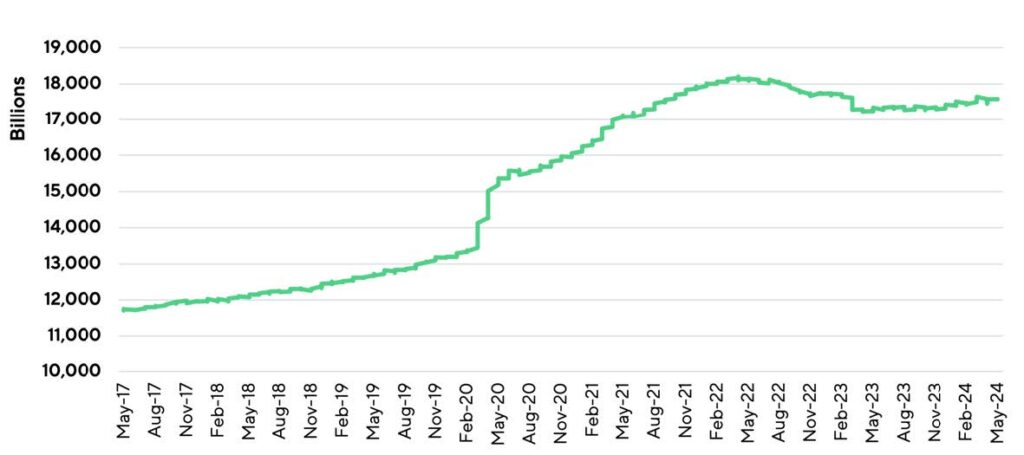
I have typically been predicting modest but steady deposit growth. Chart 3 presents the last seven years of total deposit growth. Prior to the pandemic and post the financial crisis, annual deposit growth initially averaged about 7.5% but gradually declined to about 4.0%. My prediction has been that we would resume deposit but that it would be less than the pre-pandemic growth rate. Over the past year deposit growth has been 2.0%. Last quarter I noted, “With market rates likely constant and modest economic growth coupled with slowly declining inflation, I have been predicting a resumption of relatively steady deposit growth.” That appears to remain a safe prediction. With the pandemic, the Fed introduced a tremendous amount of liquidity into the financial system. That “sugar high” is over and with modest economic growth we should expect to see modest deposit growth, much as we have seen in the past year.
Chart 3
About MountainView Risk & Analytics
For over two decades, MountainView Risk & Analytics, A SitusAMC company, has helped clients accurately forecast outcomes and make balance-sheet decisions through an integrated methodology and advanced statistical modeling that incorporates a multi-layered, institution-specific analysis. We assist clients in developing credit risk, model risk and enterprise risk strategies and infrastructures to achieve optimal profits, as well as assessing and quantifying the various risks embedded within the organization. Our team collaborates with clients and provides insights and best practices from engagements across the country, bringing this knowledge to bear on every assignment to assist clients in their business needs. If you would like to learn more about working with MVRA please submit a request to connect today!