
Commentary provided by Dr. Richard Sheehan, Economist
Today I will start with a somewhat different perspective on the U.S. history of GDP. Typically we examine the level of GDP and how it compares with potential GDP. Chart 1, instead, presents the annual growth rate in GDP over the longest range possible. Why the change? Emphasize two points. First, the graph suggests that in the post-WWII era, we have maintained a roughly constant rate of growth in GDP, roughly 2.5 percent. And second, the variability in the growth rate has declined dramatically. In the last 40 years, we have had 4 recessions. In the prior 40 years, we had 8 recessions. Recessions appear to be about equally long over the entire period, on average slightly less than 1 year, but expansions have more than doubled in length, from less than 4 years to about 8.5 years.
CHART 1: GDP Growth Rate Annual
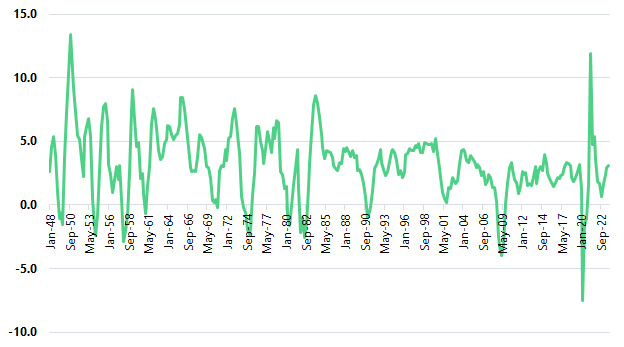
Why? There are many explanations available. Arguably, we have a more open economy now so shocks to the U.S. economy may be less likely to send the economy into a recession. Or perhaps we simply have fewer shocks to our economy? While those are possibilities, I think a better explanation is simply that monetary policymakers have a substantially better understanding of how their actions impact the economy and how they can better use the tools at their disposal to offset shocks.
I can state with certainty that we will have another recession; I cannot state with certainty when it will happen. However, the data in Chart 1 strongly suggests that – absent a severe shock – a recession is relatively unlikely to occur in the next couple of years.
The past two years have seen a wide range of economic forecasters predicting a recession in 2023-24. For much of that period, I thought that the probability of a recession was a coin flip. I am more optimistic now and think the probability of a recession is less than 10 percent, again absent a severe shock, e.g. expansion of the Middle East conflict, a dramatic rise in oil prices, another pandemic, a prolonged government shutdown, or the start of a trade war.
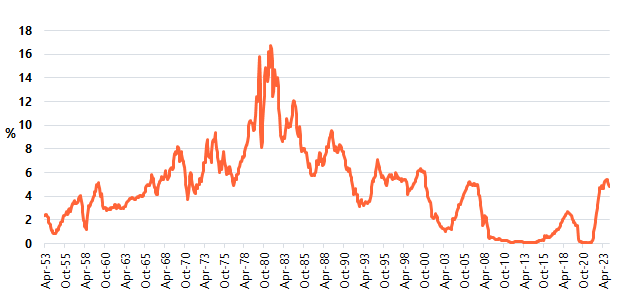
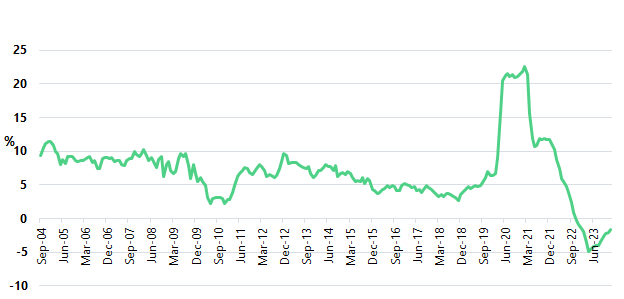
To understand why a recession has not yet occurred and why it appears that we will have a soft landing, it is important to put the Fed’s actions into context. Chart 2 presents the longest range possible of the 1-year Treasury rate. Most stories about Fed actions over the past two years have focused on the Fed increasing rates very aggressively and to their highest levels in over 20 years. Those statements are correct but misleading. Rates remain higher now than they have been since before the financial crisis. But as Chart 2 indicates, those recent rates have been historically low. The last time the Fed fought a serious battle with inflation, was during the early 1980’s, the Federal funds rate increased briefly to over 19 percent and remained over 10 percent for about 30 months. Inflation was arguably a bigger problem then, but it is important to put recent Fed actions in a longer historical context. Fed-initiated rate increases in the past two years have appeared aggressively contractionary considering the extremely low interest rates that we have become accustomed to. But it is those low rates that are historically unusual, not the recent rate increases. Recent rates come nowhere near the heights they reached during most prior periods of contractionary monetary policy.
CHART 2: 1 Year Constant Maturity Treasury Rate
Monetary policy has fundamentally changed over the past 20 years. The financial press typically focuses on the Federal Reserve changing the Federal funds rate. The funds rate used to be viewed as the primary signaling method for the Fed revealing how it was conducting monetary policy. Higher rates signaled contraction; lower signaled expansion. The Fed continues to use changes and expected future changes in the funds rate to signal its policy, as Jerome Powell, Chair of the Federal Reserve, recently stated that he expected three rate cuts this year. The actual policy tool, however, was typically viewed as changing the money supply, following Milton Friedman’s classic book, A Monetary History of the United States, 1867-1960. In practice, the Fed controls the monetary base (MB) and manipulates MB to obtain the desired money supply to achieve money market equilibrium at the desired interest rate.
We have seen two major changes to this approach since the onset of the Great Recession. The first was Quantitative Easing (QE). The Fed drove down as low as possible but continued to increase the MB even without the possibility of further rate decreases. The underlying logic? Rather than stimulate the economy through lower interest rates, try to stimulate the economy through increased liquidity. That action, however, at least partially breaks the link between the funds rate and the monetary base. Relying on changes in the funds rate to signal what the Fed is doing becomes more challenging. When interpreting what the Fed is doing, my preference is to focus on the MB rather than on the funds rate since the Fed directly controls the MB while the funds rate is a target that need not necessarily move when the Fed changes MB.
CHART 3: Monetary Base
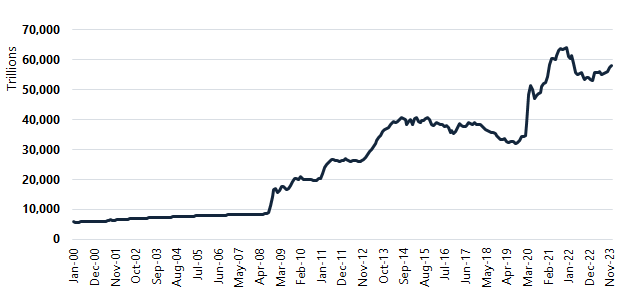
Chart 3 presents the MB and suggests that the MB has been used very differently since the Great Recession. Until late 2008 the MB increased gradually and without substantial month-to-month fluctuations. Since then, the Fed has been much more aggressive in its changes with large increases to stimulate the economy during the Great Recession and COVID-19 and then gradual decreases to unwind its position in Treasury bonds and Mortgage-Backed Securities (MBS), e.g. from October 2014 through late 2019. Nevertheless, both pre and post the Great Recession, the Fed has been using the MB to keep the effective funds rate in the Fed’s target funds rate range.
During QE it is clear that movements in MB were disconnected from changes in the funds rate. That was the point of QE. More recently we also saw a break between the two. Looking at the right tail of Chart 3, we see that the Fed has been increasing the MB since February 2023 indicating that monetary policy has been somewhat expansionary for about a year. In contrast, the last funds rate increase occurred July 27, 2023, 6 months after the Fed started increasing the MB. The simplest explanation for the divergence is that the Fed wanted to ensure that the economy did not move into a recession while at the same time signaling that it remained concerned about inflation.
The change in how the Fed has used the MB, however, may be less important than the other change implemented by the Fed. Starting in October 2008, the Fed began paying interest on deposits and modified its procedure in July 2021 with IORB, Interest on Reserve Balances. While the Fed now presents a target range for the funds rate, it sets the IORB. Currently, it is 5.40% while the upper limit of the funds rate is 5.50%. The Fed has also moved IORB and the funds rate targets in tandem, starting with an upper limit of the funds rate at 0.25% and IORB at 0.15%. The Fed may at some point place more emphasis on IORB since it controls that directly while the effective Federal funds rate is market determined. To date, they have shown no interest in doing so.
When short-term rates like the funds rate are near zero, the role played by the IORB is relatively small. However, as rates rise, IORB potentially puts a floor on loan rates. For example, the current IORB is 5.40% and Freddie Mac’s survey of 15-year fixed-rate mortgages indicates a 5.90% average for the week of February 8, 2024. Were the Fed to increase IORB tomorrow by 50 bps, it is quite likely that the 15-year mortgage rate would increase by 50 bps almost immediately. That may happen with an increase in the funds rate also, but the impact of the funds rate could be more gradual and could be phased in with slower decreases to the monetary base. In theory, the Fed could substantially reduce its reliance on changes in the MB to impact the money supply if it were to switch to IORB. My expectation, however, is that the Fed will choose to emphasize using the MB to change the funds rate, maintaining somewhat more nuance to monetary policy, and also maintain the ability to de-link IORB and the funds rate if necessary.
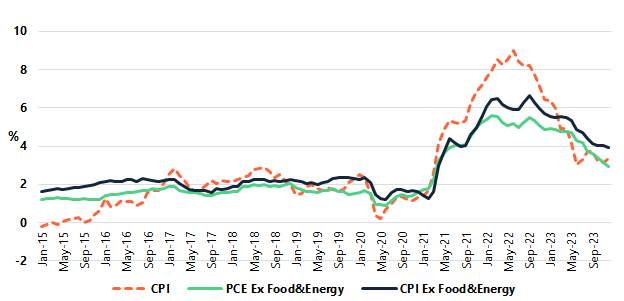
Turning briefly to macro variables, Chart 1 indicates that we have relatively strong economic growth as measured by GDP, with growth marginally above our long-term trend. Ancillary measures like Retail Sales and Industrial Production are also strong but not suggestive of any future inflation. The unemployment rate remains below 4 percent, but wage increases remain moderate. Alternative measures of inflation are presented in Chart 4. All measures of inflation are trending down, albeit perhaps not quite as quickly as the Fed might like and with a small uptick in the last couple of months. The downward trend appears clear, however, and it does not appear that the Fed will take further contractionary steps to attempt to curb inflation or accelerate its decline. Most macro data is consistent with continued economic growth. That does not imply that we will not have a recession. It does imply that a recession is relatively unlikely, again in the absence of any macro shocks. Monetary policy is then likely to remain neutral to slightly expansionary.
CHART 4: Alternate Measures of Inflation
The standard concluding question is what does this mean for deposits and deposit growth? With market rates no longer increasing and with modest economic growth coupled with slowly declining inflation, I have been predicting a resumption of relatively steady deposit growth. Chart 5, following Chart 1, considers a percent change, this time in total bank deposits. We have seen a turn-around in deposit growth, albeit not as large as I had anticipated. I expect that this trend increase will continue, and deposit growth will continue to accelerate. However, I do not think that the long-term growth rate will increase back to its pre-pandemic range of 3+ percent. That conclusion follows from the Fed having provided an unprecedented amount of liquidity to the financial system with the very high MB, noted in Chart 3, coupled with the Fed’s likely desire to unwind its exposure to non-Treasury securities as it was doing in the period following the Great Recession. Historically, increases in overall liquidity have been associated with inflationary pressures. That result has not been the case since the recession, but the Fed certainly understands the potential if not actual inflationary pressures of high liquidity. I expect that the Fed will continue with small increases in MB in the short term, while also slowly reducing the funds rate and IORB. Simply stated, Fed policy will likely be conventional and marginally expansionary. In the longer term, however, it would not be surprising to see the Fed begin to decrease MB even while it may further reduce rates. While that result may appear counterintuitive and run against conventional wisdom on the conduct of monetary policy, it would satisfy two likely Fed goals. First, it would continue with a modest expansionary policy and bring interest rates closer to what we are used to in the past 15 years. Second, it would be unwinding its bond portfolio putting it in a position to better address future challenges.
CHART 5: Total Deposits – Year over Year % Change
About MountainView Risk & Analytics
For over two decades, MountainView Risk & Analytics, A SitusAMC company, has helped clients accurately forecast outcomes and make balance-sheet decisions through an integrated methodology and advanced statistical modeling that incorporates a multi-layered, institution-specific analysis. We assist clients in developing credit risk, model risk and enterprise risk strategies and infrastructures to achieve optimal profits, as well as assessing and quantifying the various risks embedded within the organization. Our team collaborates with clients and provides insights and best practices from engagements across the country, bringing this knowledge to bear on every assignment to assist clients in their business needs. If you would like to learn more about working with MVRA please submit a request to connect today!