
As we roll into 2021 the overall state of the economy looks better than it has in over a year. The University of Michigan’s Index of Consumer Sentiment has risen substantially and now stands at the same level as 2013-14. Vaccines are now widely available in the U.S. Restrictions on face masks and gatherings are gradually being reversed. Travel restrictions are also starting to loosen. On the economic front, monetary policy remains extremely expansionary as does fiscal policy, with the potential to become even more expansionary.
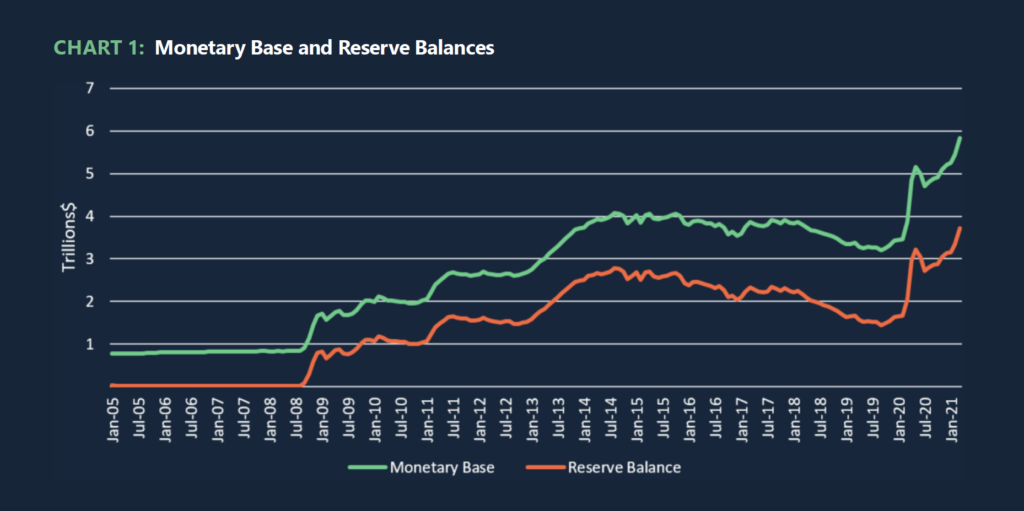
While the recent economic news generally is strongly positive, there remain substantial concerns and uncertainties. However, let’s start with the positives. First, Chart 1 updates last quarter’s view of the monetary base and bank reserves. The monetary base is the Federal Reserve’s primary tool for impacting the economy and it continues its unprecedented growth. At the end of 2019, just before the COVID-19 pandemic hit the U.S., the monetary base (MB) was $3.5 trillion. By the end of 2020 (and the last market summary) it stood at $5.2 trillion, and in the last three months has increased to $5.8 trillion. This is an increase of $600 billion in just one quarter. That one quarter increase rivals the lengthier actions taken by the Fed in response to the Great Recession. While the Fed does not have the capability with its current procedures to further reduce interest rates, which is commonly viewed as the method the Fed uses to stimulate the economy, the increase clearly demonstrates that the Fed is committed to provide substantial liquidity to the financial system in an effort to ensure continued economic growth.
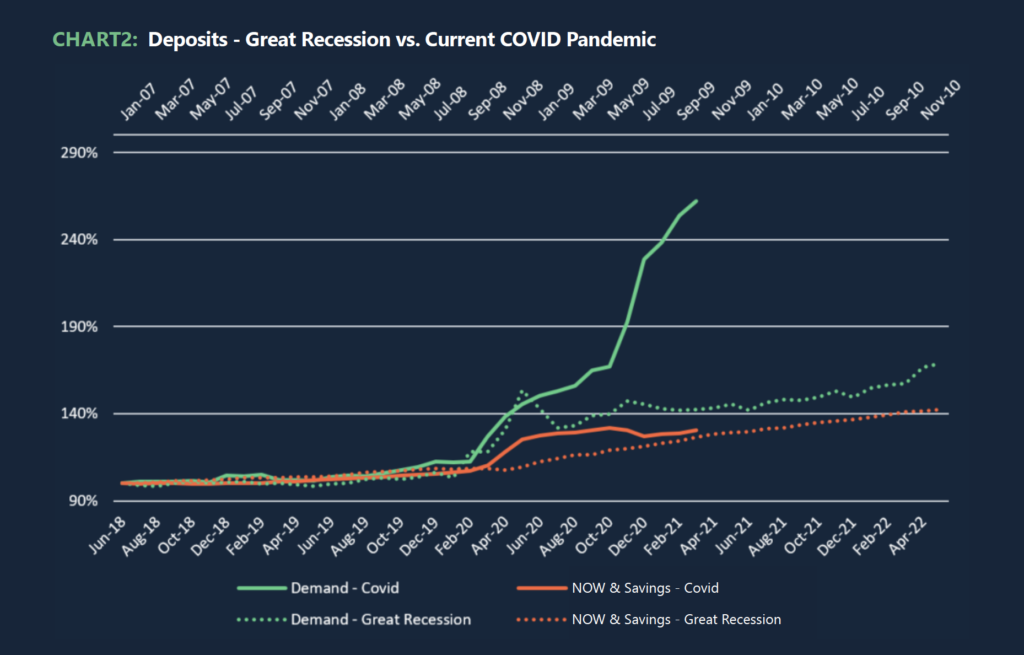
The impact of the Fed’s expansionary policy is clearly visible in Chart 2, looking at growth in deposits for the Great Recession versus the COVID-19 crisis. The two periods are plotted on one graph with the values indexed, the Great Recession to its January 2007 value and the COVID-19 crisis to July 2018. The Great Recession prompted not only an increase in the level of deposits, but also a higher growth rate. Pre-crises, the two lines are similar with a slightly higher growth rate in the recent period. And at the start of the two crises, the two lines look similar with a major increase in demand deposits in the first few months of the crises. Subsequent months show a dramatic difference. During the Great Recession there was an increase at the outset of the crisis and afterwards a slightly higher growth rate. The COVID-19 crisis has also seen an increase, but that has been followed by an even higher growth rate. The growth in NOW/Savings deposits has fallen from the prior highs, however, and it now resembles the Great Recession trajectory.
What has caused this continuing growth? There are competing perspectives. One is that the closure of bars, restaurants, gyms, movie theaters, beauty parlors, etc. was a forced reduction of supply, that in turn reduced demand for many services, and households then saved those funds. Another perspective is that the stimulus packages provided so much funding that many households simply saved those checks. The Federal government attempted to increase demand, but the supply restrictions reduced the effectiveness of the stimulus package. The data, however, suggests that while both may play a role, the timing of the growth does not align well with either hypothesis. In particular, the first perspective suggests that as vaccines rolled out and supply restrictions were removed, the 2021 deposit growth would slow, if not turn negative as demand increased. This result is not well matched by the data. The second perspective suggests that there would be surges in deposits with the timing of stimulus payments, and slower growth otherwise. But that timing is not well reflected in a continuous increase in deposits. The continued growth in deposits, however, is consistent with the Fed’s expansion of the monetary base and its push for greater liquidity. Monetary policy rather than fiscal policy appears to play the most important role in increasing the level of deposits.
If the Fed’s efforts to increase liquidity are the most important cause for the increase in deposits, then deposit growth is likely to remain very strong through 2021 and perhaps into 2022, even in the absence of further fiscal stimulus.
Returning to Chart 1, note that in response to the Great Recession the Fed increased the monetary base by approximately $2 trillion over a period from late 2008 through 2014. It then gradually unwound those positions, taking almost five years, through mid-2019. While each crisis generates a unique Fed response, the Fed’s Great Recession response is suggestive of how it will likely approach the next few years of recovery.
The Fed has been much more aggressive in attempting to deal with COVID-19. The Fed may be responding to concerns that it was not aggressive enough in dealing with the prior crisis, in particular in 2010, and recognizing that three rounds of Quantitative Easing (QE) was a sub-optimal strategy to create a strong recovery. The current actions suggest that the Fed is unlikely to suddenly change course, and the monetary base over the rest of 2021 is likely to continue to increase, perhaps by another $500 billion to $1 trillion. In that case, deposits are likely to continue to grow aggressively even as the economy reopens. By mid to late 2022, given current growth projections, the Fed’s policy likely will again include a gradual unwinding of the positions amassed during the current crisis. From a deposit perspective, this scenario suggests (1) strong deposit growth will likely continue at least through 2021 and (2) deposit growth will decline perhaps by mid-2022, although its overall balance will probably remain relatively high.
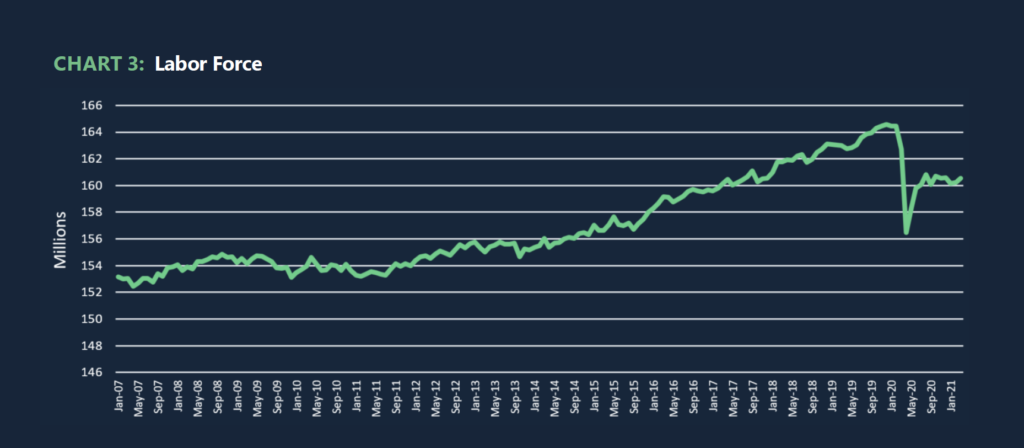
Turning to the negatives, the biggest negative in the current economy is captured in Chart 3 which presents civilian labor force data. The series has an increasing trend, as expected given a growing population. The Great Recession reduced the labor force by almost 2 million from late 2009 into 2011, largely due to people dropping out of the labor force due to a lack of jobs and decreased labor demand. In late 2011 it resumed its upward trend which lasted until February 2020. By April 2020, just two months later, the labor force had declined by about 8 million, largely due to a forced drop in demand. While it bounced back by almost 4 million by July, it has since then leveled out at approximately 4 million less than its pre-pandemic level. Until the labor force returns to substantial growth and approaches its prior trend, it is likely that the Fed will continue with expansionary monetary policy. From the perspective of deposit growth, that would be good news. From the perspective of interest rate spreads, including net interest margins, that would be bad news.
The other negative is simply the very high level of uncertainty we face. We ended our prior market summary by noting that a lot of things could go wrong. Perhaps the most significant is the potential for a resurgent virus, with potential mutations and a lack of willingness to be vaccinated implying that we never achieve “herd immunity.” China has become increasingly aggressive both militarily and in terms of impacting monetary policy as they introduce a digital currency. And we face an increasingly divided electorate that does not agree on basic facts. Despite those concerns, I remain cautiously optimistic about a substantial and sustained recovery. The Fed clearly has learned lessons from the financial crisis and has tailored its response in the current crisis, and the U.S. vaccination rates are among the world’s best. Both factors provide fertile ground for a strong recovery.
Commentary provided by Dr. Richard Sheehan, Economist
About MountainView Risk & Analytics
For over two decades, MountainView Risk & Analytics, A SitusAMC company, has helped clients accurately forecast outcomes and make balance-sheet decisions through an integrated methodology and advanced statistical modeling that incorporates a multi-layered, institution-specific analysis. We assist clients in developing credit risk, model risk and enterprise risk strategies and infrastructures to achieve optimal profits, as well as assessing and quantifying the various risks embedded within the organization. Our team collaborates with clients and provides insights and best practices from engagements across the country, bringing this knowledge to bear on every assignment to assist clients in their business needs. If you would like to learn more about working with MVRA please submit a request to connect today!