
Commentary provided by Dr. Richard Sheehan, Economist
Let me start with a quick summary of the macroeconomy. Inflation continues its slow decline, and we still have a nontrivial probability of a recession within the next six months. Sound familiar? It should. It has been my statement for almost a year with my most likely forecast being that inflation would decline slowly and, while a recession was certainly possible, it was not likely although events like contractionary monetary policy could generate a recession. However, the similarity of this quarter’s and prior quarters’ summaries, lies in substantial differences in the underlying circumstances.
Before getting to the macro analysis, since the focus is on the impact on deposits, I need to insert a brief aside on the failures of Silicon Valley Bank (SVB) and Signature Bank. Both suffered from substantial outflows of deposits. In light of their failures, the obvious question for every financial institution is whether you face the same risk. Given the increase in interest rates and the resulting decrease in current market values of many asset types, e.g., mortgages and bonds, if you were forced to liquidate, say 25% of your portfolio due to a bank run, your losses may exceed your capital. If you have a large percentage of deposits that are uninsured and if you have a concentrated customer base that is mobile, then you would have a potentially major problem, i.e., a run on your institution. The runs on SVB and Signature indicate the potential problem. The well-reported struggles of First Republic, Comerica, and KeyCorp suggest that the problems could become much more widespread. But the actions of regulators including the Federal Reserve imply that they are well aware of the problem – albeit perhaps acting a bit too late – and will take all steps necessary to preclude general contagion.
The act of making whole all uninsured depositors, however, is not without problems. Specifically, it suggests that regulators will bail out a much wider set of financial institutions than those currently deemed as potentially posing a systemic risk. And it is clear in retrospect that SVB likely did potentially pose a systemic risk given its concentration of venture capital related firms. Three questions will need to be addressed. First, how do we determine which institutions pose a systemic risk? The answer likely will need to be more nuanced than it is currently. Second, does bank insurance need to be re-examined if, so-called uninsured deposits are really, de facto, insured? And third, regulator actions this time potentially give bank leadership an incentive to increase risk-taking since the penalties for failing appear smaller. This result is likely not what regulators desire.
The implications for everyone? First, banking regulation is likely to change substantially relatively soon. That is something that you likely can do relatively little about. And second, it is critical to understand your depositor base and the likely retention rate of your deposits. Do you have a material amount of uninsured deposits? Do you know the retention rate of your deposits and the sensitivity of that retention rate to interest rate changes? If you have a material amount of uninsured deposits, does the retention rate of those deposits differ from that of insured deposits? Answers to those questions are critical to understanding your exposure to risk and maintaining profitability with interest rate changes.
Turning back to macroeconomics and inflation, the narrative in the press has changed appreciably over the last quarter, changing from “inflation is high” to “inflation is declining.” As I have noted for a few quarters, inflation has been declining since June 2022. Chart 1 presents recent inflation history, as usual with multiple measures including the standard Consumer Price Index (CPI), plus the Federal Reserve’s preferred measure, Personal Consumption Expenditures (PCE) both overall and core, and the 5-year expectations of inflation, that is, the 5-year breakeven rate (the difference between nominal and real 5-year Treasury bond rates).
CHART 1: Alternative Measures of Inflation
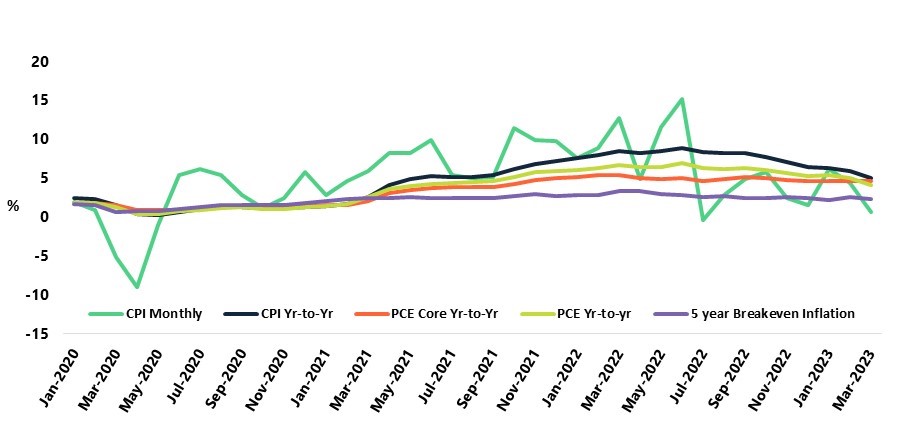
The month-to-month changes in the CPI indicate the volatility of the signal and suggest the difficulty of using the CPI to easily indicate the direction of coming inflation. Monthly changes since June 2022, however, have been relatively low and near the Fed’s target rate for price increases of about 2%. Since then, the annual rate of change – the black line – has been strongly trending down indicating inflation has slowed appreciably, decreasing from almost 9% down to 5%. Previously I have noted that the CPI may have overstated inflation as a problem, certainly compared with the Fed’s preferred measure, PCE. It is important now to note that PCE, both measures, are also trending down. But their declines are smaller, with the overall PCE declining from 7% to 5% through March 1st. On the positive side, these trends are likely to continue. On the negative side, it is also likely the pace of decline is likely to slow.
CHART 2: Monetary Policy: Fed Funds Rate and Monetary Base
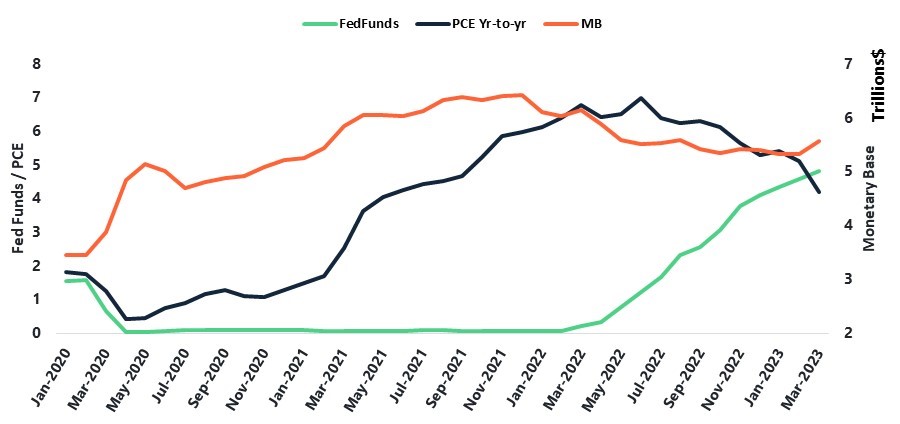
Why? Chart 2 suggests the answer by presenting both recent inflation and the Fed’s tools, the monetary base (MB) and the Federal Funds rate. The Fed has been pursuing contractionary monetary policy since December 2021 with declines in the MB. Funds rate increases began in March 2022 and accelerated from June through December and have slowed since then. Inflation peaked in June 2022 and has been relatively low since then. Conventional wisdom has correctly concluded that the Fed’s policy has reduced inflation. But the key to that policy has likely been the Fed’s changes in the MB while changes in the Funds rate have been used more as a signal than as a policy instrument. Even as the Fed has continued increasing the Funds rate through its May meeting, it stopped decreasing the MB in October 2022 and kept it roughly unchanged through February 2023. In March, however, the Fed substantially increased the MB for the first time since early 2021 when the primary issue was helping the economy recover from Covid. This recent change in MB suggests that the Fed’s focus now is on attempting to mitigate any economic slowdown. That is not to argue that the Fed is unconcerned about the potential for future inflation. It does suggest that the Fed understands that upward price pressure inconsistent with its inflation target has been limited since last July and now is most concerned with initiating a “soft landing” and avoiding a recession. The Fed’s actions do suggest that its ability or willingness to further quickly reduce the rate of price increases is likely constrained. Without demand pressure, you should expect inflation to decline but only slowly.
I must admit that I was surprised by the May increase in the Funds rate. Given the increase in the MB, the recent closure of First Republic, and the gradual slowdown in inflation, it would not have been surprising for the Fed to make no change in the Funds rate. That they chose to undertake what appears to be their last increase for 2023 may be more a reflection on the lessons of the mid-1980’s rather than a commentary on 2023. In that earlier and more severe inflationary period, the Fed thought that they had inflation under control and loosened monetary policy before the job of eliminating inflation was finished. The Fed had to undertake a second round of contractionary policy and sent the economy into a second recession.
While the Fed did increase the Funds rate by 25 bps, it is instructive to consider the impact on the Treasury yield curve. The table presents Treasury rate before and after the Fed’s actions.
Two points should be emphasized. First, while the Fed did raise the Funds rate, with the exception of the one-month rate, Treasury rates decreased with the decline of the 3-year rate down almost 40 bps. Conventional wisdom is that an inverted yield curve signals a recession. I think that interpretation is somewhat misleading. A more accurate perspective is that an inverted yield curve indicates the market’s expectation is the Fed will be pursuing less contractionary policy in the future. That less contractionary policy could be due to an economic slowdown, but it could also be due to Fed being less concerned about inflation.
Second, note that both nominal and real (TIPS) rates declined. The spread is interpreted as the breakeven inflation rate or the expected inflation rate. While the TIPS rates also decreased, the 5-year spread also decreased by 9 bps. That decrease, which is large for a short time-period, suggests that the Fed’s actions have substantially reduced expected inflation.
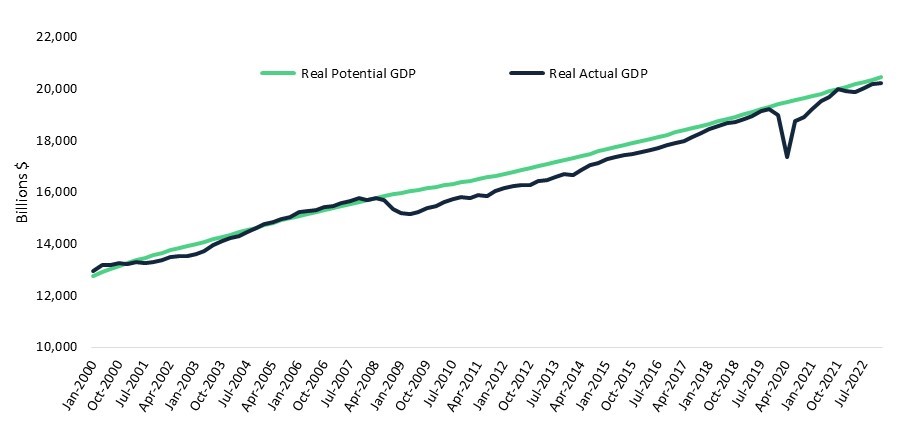
Turning to the potential for a recession, Chart 3 presents Actual vs. Potential Real GDP with the difference between the two being excess demand, historically the prime driver of inflation. When actual GDP exceeds potential GDP, inflation is typically the result and the Fed typically steps in to avert accelerating inflation. The Fed took those actions before the Great Recession and was beginning to take similar steps just before the onset of Covid. The gap between potential and actual GDP since the second quarter of 2022 indicates that excess demand does not cause inflation. Previously I have emphasized that supply shocks have likely been the primary cause of inflation. And I noted last quarter that overly aggressive contractionary monetary policy was the most likely factor that could lead to a recession. Supply disruptions have been reduced substantially over the past year and the Fed’s policy now appears neutral to slightly expansionary. Both changes reduce the likelihood of a recession in 2023 through early 2024. But as those potential problems recede, another “old friend” returns, increasing the debt ceiling.
CHART 3: Actual vs. Potential GDP
We have played with this political football repeatedly with no one wanting to vote to increase it. Whether it is through tax cuts or increases in spending, war or a slowdown in the economy, there will be periods when the economy runs a deficit and times when the debt ceiling needs to be increased. Let me be clear. The need to raise the debt ceiling is based on previous spending and taxing decisions. It is not based on current tax and spending decisions. It is equivalent to a family making decisions to put things on a credit card and then attempting to not pay the charges because they want or plan on cutting future spending or increasing future income. Both Democrats and Republicans previously have played the game of voting against raising the debt limit. It was irresponsible then and it is irresponsible now. When the issue arose previously, there was an off-ramp to avoid default. This time, I do not see a viable off-ramp. The tiny Republican margin in the House makes compromise much more difficult, and the list of their demands to vote to increase the debt ceiling should appear unreasonable even to them.
Will we have a recession? Before the most recent Funds rate increase, I would have bet– but not heavily! – that we avoid a recession. With the most recent Funds rate increase, I think that tips the scales ever so slightly to likely having a recession. But those predictions are made in the absence of a government default. Either way, I would expect growth for the remainder of the year to be low but potentially positive and increasing later in the year as monetary policy becomes more expansionary with continued expansion in the MB. With a government default, a recession and possibly a severe recession will be hard to avoid.
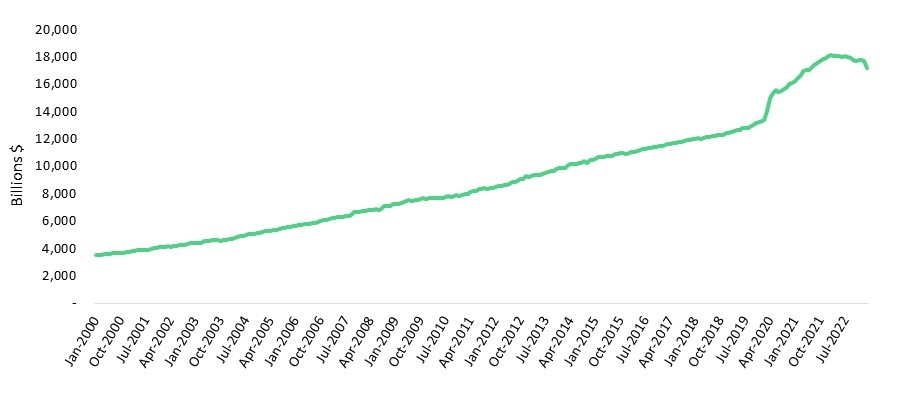
Absent a government default, I expect deposit growth to resume. Chart 4 presents aggregate Total Deposits. Over the past year, deposits have declined by about 5%. In March alone deposits dropped by almost 3%. The recent acceleration in decline is likely due to the closures of SVB and Signature and a heightened awareness and concern about default among uninsured depositors. That decline is unlikely to continue. The weekly data is consistent with that point, with no further decline from 3/29 through 4/12. Even before that shock, however, deposits were decreasing. Those decreases appear largely due to the Fed’s effort to shrink its balance sheet, offset its prior Quantitative Easing (QE), and undertake contractionary monetary policy. With those efforts removed, that reason for shrinking deposits disappears. In the short term, however, expected slow economic growth together with modest expansionary monetary policy suggests that deposit growth will return but nowhere near the growth experienced in 2020-2021 and likely even slightly lower than the long-term trend in Chart 4.
CHART 4: Total Deposits
Last quarter I concluded “Whether we have a recession and whether deposits continue to decrease is largely – but not exclusively – in the Fed’s hands. Obviously, we could have further supply shocks that could trigger a global recession, with China, Russia, and climate change likely the biggest risk factors. But potential Fed actions to fight inflation may have a higher probability of causing a recession, with deposits declining a secondary result.” The Fed appears to have played its hand with only one small rate increases and a modest increase in the monetary base. Now, the safest conclusion is that whether we have a recession and a continued decrease in deposits is largely dependent on raising the debt ceiling without incurring a government default. At the macro level, we appear to be at roughly the same point as last quarter or last year, but with a dramatically different underlying problem.
About MountainView Risk & Analytics
For over two decades, MountainView Risk & Analytics, A SitusAMC company, has helped clients accurately forecast outcomes and make balance-sheet decisions through an integrated methodology and advanced statistical modeling that incorporates a multi-layered, institution-specific analysis. We assist clients in developing credit risk, model risk and enterprise risk strategies and infrastructures to achieve optimal profits, as well as assessing and quantifying the various risks embedded within the organization. Our team collaborates with clients and provides insights and best practices from engagements across the country, bringing this knowledge to bear on every assignment to assist clients in their business needs. If you would like to learn more about working with MVRA please submit a request to connect today!