
Commentary provided by Dr. Richard Sheehan, Economist
This quarter’s summary will differ from prior quarters. I want to address three issues. First, what has generated inflation, and will it continue? Second, are we in a recession or heading into a recession? And third, what are the implications for deposits? The difference, however, is that I will be presenting a lot of macro data that will show, for example, what is and what is not generating inflation.
Inflation
First up, what are the potential causes of inflation? In general, five different factors have been alleged to be causing inflation.
- Excess demand, our collective demand exceeding what is being produced, including imports.
- High government expenditures, presumably contributing to high demand.
- Excessive monetary expansion, following Milton Friedman’s perspective that inflation is fundamentally generated by excess money growth.
- Price gouging, that is firms increasing prices by more than justified by any cost increases.
- Supply shocks, factors that impact supply rather than demand.
Inflation could be caused by any single factor or by a combination of factors, and there are historical examples of inflation generated by each cause.
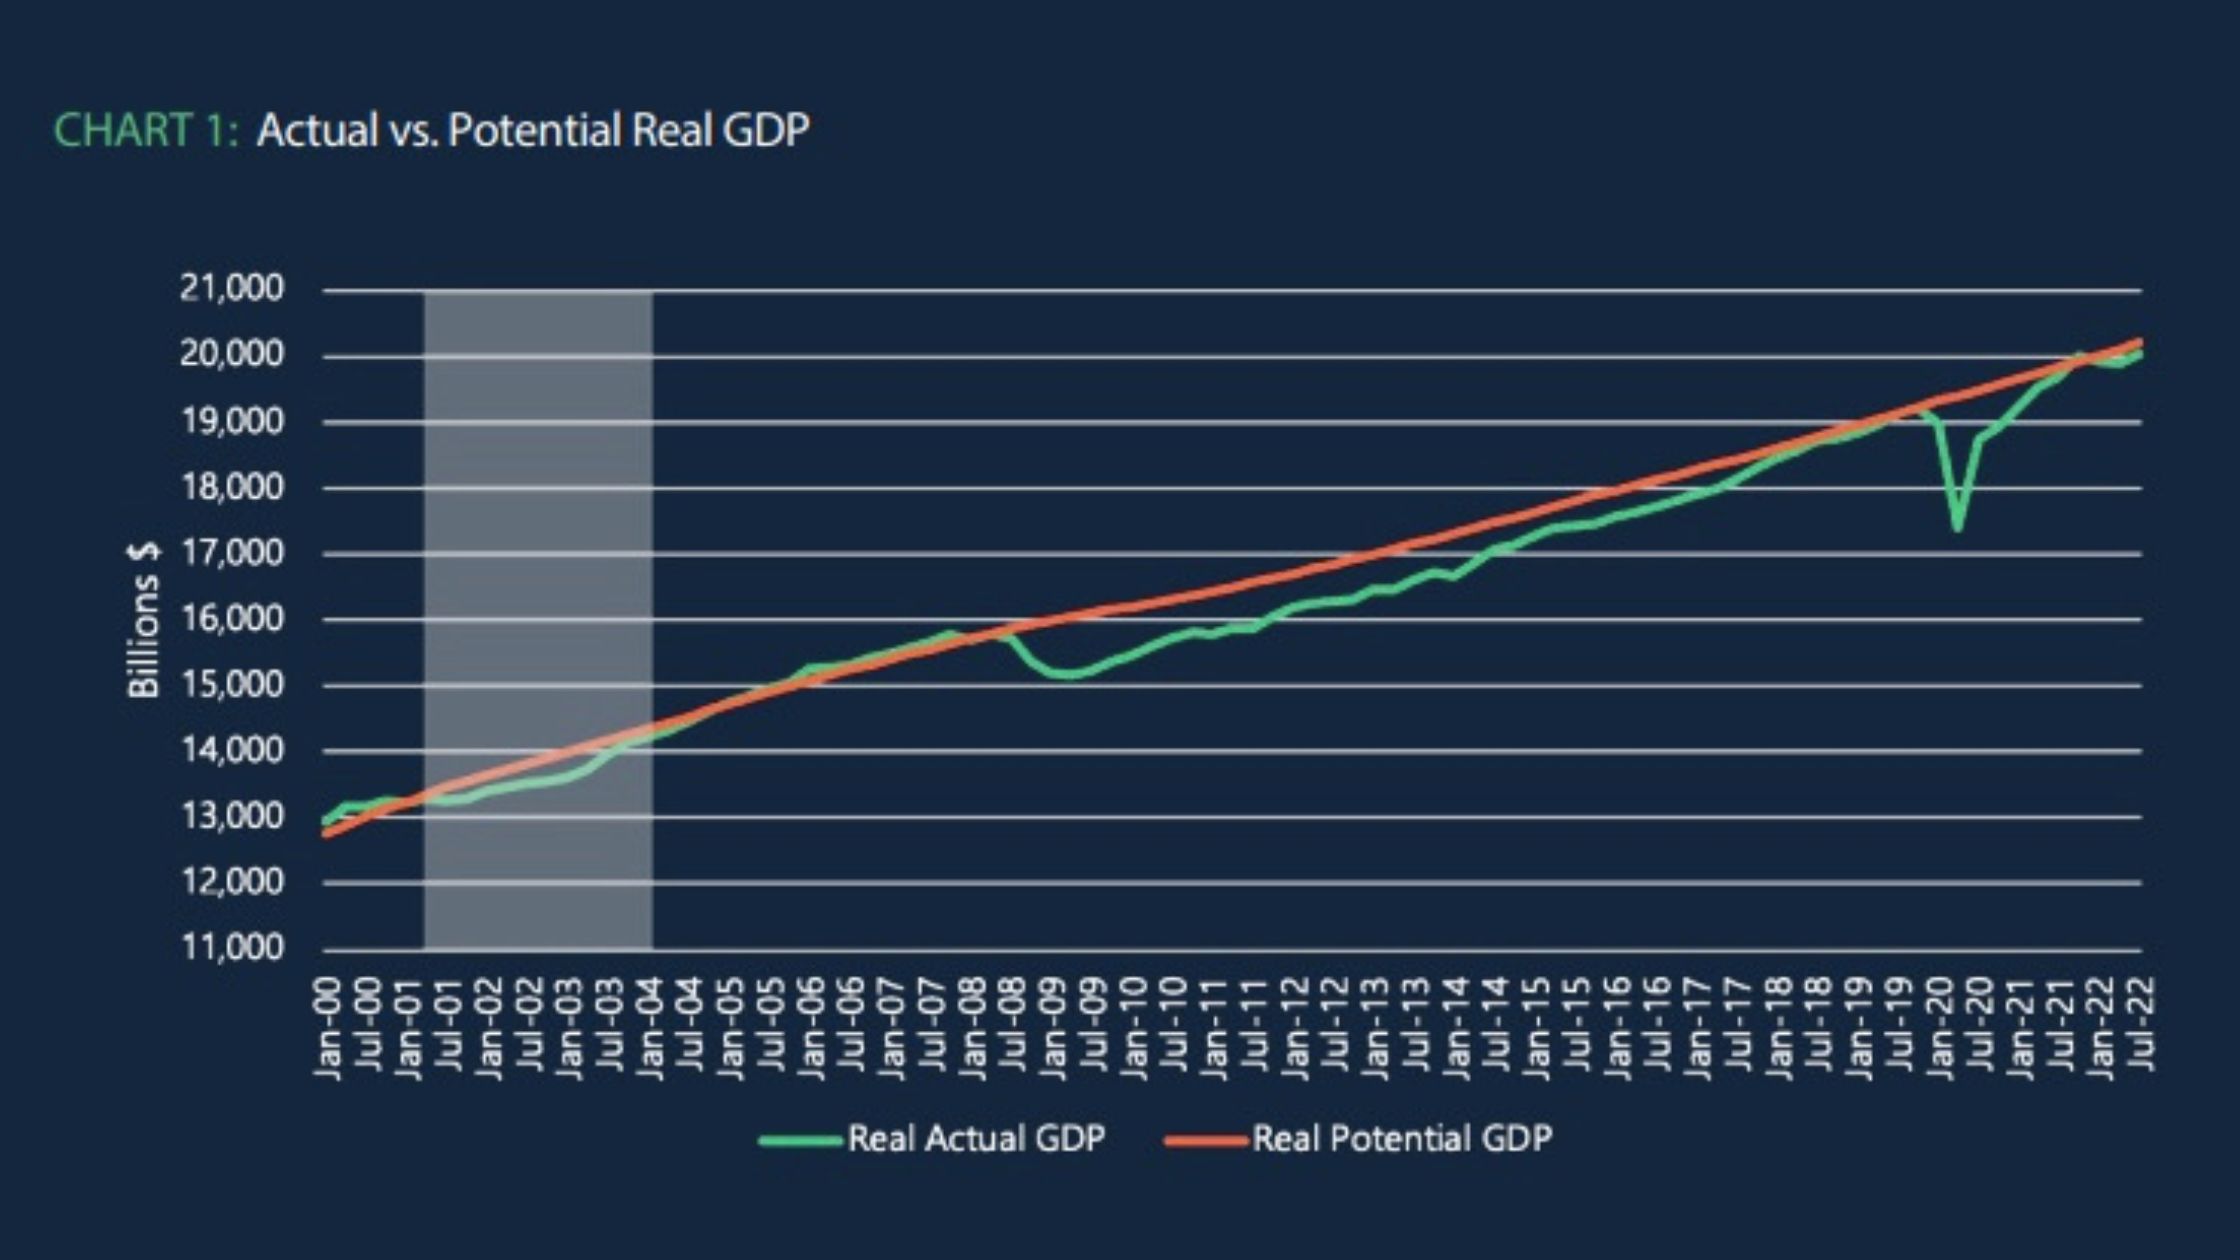
Is inflation being generated by excess demand? The first chart presents real quarterly GDP and real potential GDP. If excess demand is the main factor, we should expect to see actual GDP exceed potential GDP – or simply demand exceed supply with potential GDP effectively measuring what can potentially be supplied. While actual GDP slightly exceeded potential from 2004 through 2008, since then, particularly since the financial crisis, GDP has generally run well below potential. That gap was closed leading into the COVID crisis and again after the worst of COVID was over. But there is no recent evidence of demand exceeding supply as measured by actual vs. potential GDP.
The conclusion from Chart 1 is clear. Excess demand is not causing inflation to any substantial extent. It may be a minor contributing factor, but it would be a serious mistake to attribute current inflation to excess demand.
Second is higher government expenditures. The standard argument on government expenditures is that they are higher now than they have ever been. Technically that is correct, but it is more misleading than informative. Our population has grown; our economy has grown; successful businesses generally grow. The government should be expected to grow as well simply to maintain the existing level of services. Chart 2 presents a more appropriate way of looking at government expenditures, not as simply the amount of expenditures, even inflation adjusted, but as a percent of GDP. Chart 2 indicates that government expenditures as a percent of GDP have been steadily shrinking. It does increase during recessions, e.g., 2001, 2009, and 2020, but falls afterward and with a negative trend since 1992.
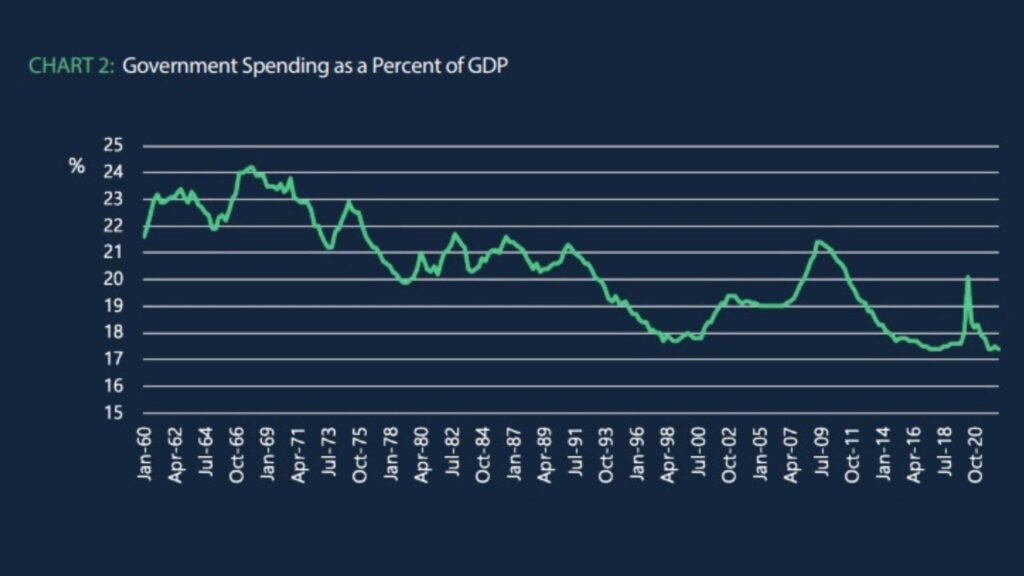
The conclusion from Chart 2 is also clear. Higher government expenditures during 2020-21 kept demand from falling even more dramatically during that period but did not generate excess demand. Thus, government expenditures are highly unlikely to have at worst been only a minor contributor to inflation.
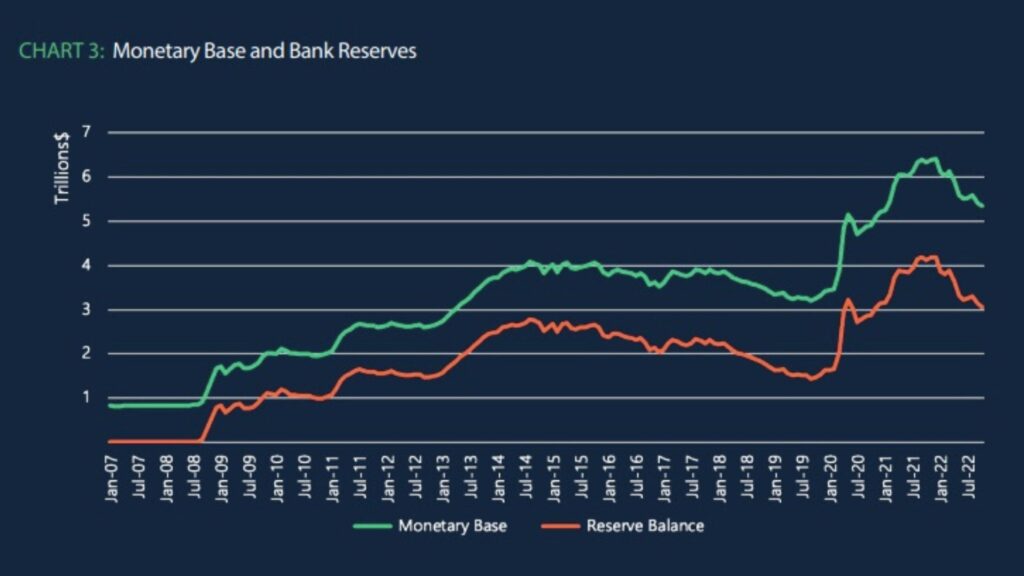
Third, whether monetary policy generated inflation is best considered by examining growth in the monetary base (MB), presented in Chart 3. Aggressive MB growth from March 2020 through mid-2021 looks like a strong candidate for creating our current inflation. That is expansionary monetary policy during that period, with a lag, generated inflation in 2022. But the story doesn’t quite line up. From 2009-14 we had even more aggressive MB expansion and no inflation. The MB increase from 2009-14 was the Fed’s response to the financial crisis and the Great Recession with three rounds of Quantitative Easing (QE), and yet there was no evidence suggesting increasing inflation. If you want to contend that the Fed’s recent QE generated the current inflation, then you also need to explain why the Fed’s prior QE did not. In addition, the Fed’s anti-inflation actions unwinding its QE began in October 2021 even though its changes in the Federal Funds rate did not begin until March 2022. Contractionary monetary policy has been undertaken for over a year. The Fed’s net increase in the MB after the Great Recession and its QE unwinding was about $2.4 trillion and the total Funds rate increase was a very gradual 2.25 percent. In contrast, with COVID the Fed’s net increase in the MB with QE and its unwinding to date is $1.5 trillion and with a total Funds rate increase of 3.75%. Could the Fed’s actions have contributed to inflation with a lag? Possibly, but if it was a major contributor then one should also expect that the Fed’s contractionary policies over the past year should have damped inflation substantially – and we have not seen that occur.
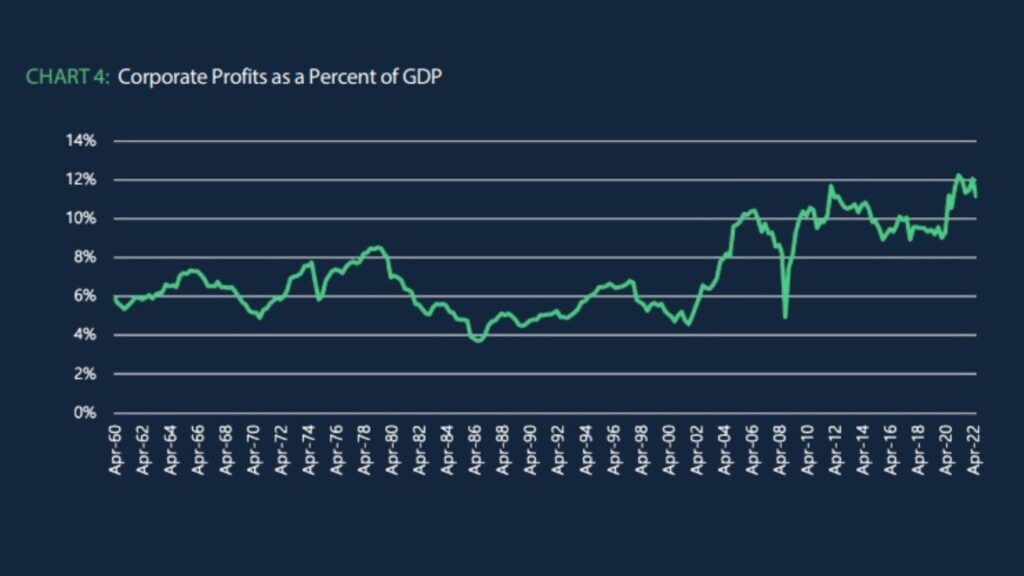
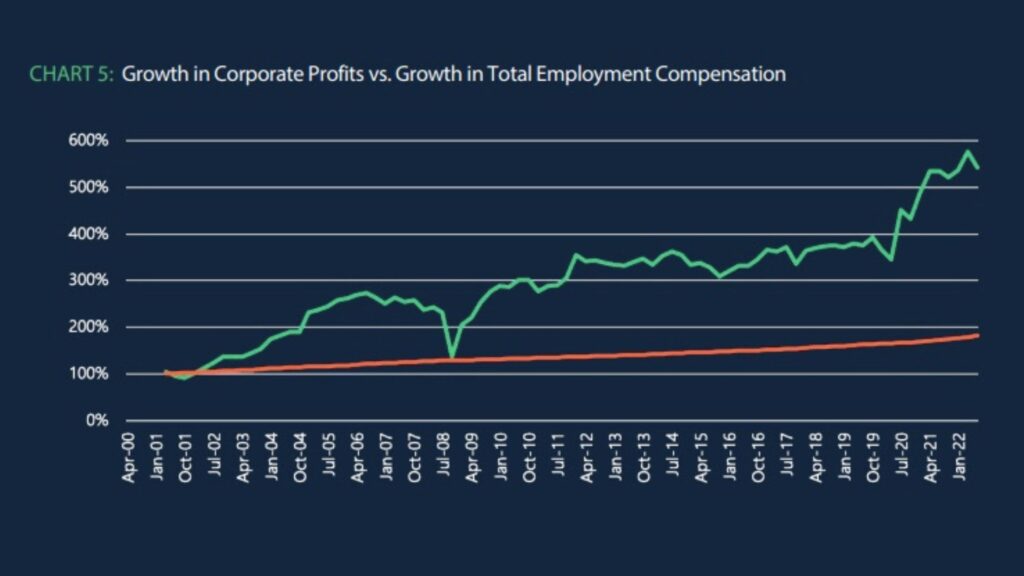
Fourth, has there been some price gouging by businesses as some have alleged? Chart 4 presents corporate profits as a share of GDP. Through about 2003 they averaged about 6% of GDP but have increased substantially since then and recently have averaged about 12% of GDP. Much of this increase occurred prior to our recent inflation, although corporate profits share has increased from about 9% to 12% since the start of COVID. The second part of Chart 4 also shows how corporate profits have grown relative to labor costs, and again there is an increase since the start of COVID. These results suggest that there is at least a kernel of truth in the contention that some firms have taken the opportunity to increase profits – and presumably prices – over the past year. However, it would be a mistake to attribute inflation primarily to this cause. Why? Because the magnitude of the price increases suggested by the increases in corporate profits is substantially less than the magnitude of the price increases observed. So-called price gouging can be held responsible only for a small part of the inflation problem.
Fifth and finally we come to supply shocks. And unfortunately, we have no great data to demonstrate their impact or lack thereof. Since January 2020 we have seen (1) COVID and economic shutdown, (2) a breakdown in supply chains, e.g., lumber, computer chips & transportation, (3) reductions in capacity, e.g., airlines, restaurants, and general travel, (4) Russia’s war on Ukraine with food and energy implications, and (5) China’s war on COVID with both supply and demand implications. COVID and the disruption in supply chains definitely contributed to price increases in 2020-21 but for most of the world, those issues have generally been resolved. Capacity reductions, most notably in airlines, have led to widely variable prices in the industries impacted but appear to have had only minor macroeconomic effects. That leaves Russia’s and China’s wars.
I have previously emphasized the difference between the overall rate of inflation and the core rate of inflation, excluding food and energy prices which can be idiosyncratic. Russia’s actions have driven up worldwide food and energy prices and have led to a substantial spread between the overall and core inflation rates. China’s actions have been less dramatic from a news perspective, but their effective reduction of supply with their COVID restrictions also have likely impacted the prices.
In sum, the standard demand side factors that generate inflation do not appear to have played a major role in our current inflation. Excess demand, expansionary monetary policy, and fiscal policy all play, at most, minor roles. Unfortunately, monetary policy is most effective in addressing inflation caused by demand-side factors and is relatively ineffective in impacting supply-side factors. The Fed cannot resolve Russia’s war or China’s COVID restrictions. Absent that ability and focusing on impacting demand means the Fed needs to reduce demand substantially if it wants to create conditions where demand-side reductions generate downward pressure on prices. Those actions could easily cause a recession. Without those actions, however, inflation will likely decrease but only very gradually.
Recession
Are we in or heading into a recession? It is easy to say we are not currently in a recession, despite having two consecutive quarters of negative GDP growth, the standard rule of thumb for defining recessions. Third quarter GDP growth of 2.6% indicates that the economy is still growing at about our long-term growth rate. Third-quarter GDP growth brings GDP back into line with other macro indicators. The labor market looks strong with the unemployment rate currently at 3.7%. Industrial production and retail sales also remain relatively strong.
The more interesting question is whether we will have a recession in 2023. Or, better phrased, what is the probability of a recession in 2023? There are yellow flags in our macro data. Consumer sentiment is at levels lower even than those from the Great Recession. Consumer saving is also low, at levels near those prior to the Great Recession. Low savings could be due to the high saving during the pandemic but it could also indicate a coming slowdown in consumption, the largest component of GDP. But the most important determinants of a future recession are simply unknown. The keys? How much will supply-side factors largely reflecting Russia’s and China’s actions continue to impact the world economy, and how aggressively will the Fed continue with contractionary monetary policy? While the Fed would like to avoid a recession, its actions indicate that short-term monetary policy is likely to continue to be contractionary, especially continuing the reduction in the MB. Inflation may gradually slow but the probability of a recession will correspondingly increase. Russia’s and China’s actions remain wild cards. Russia probably would like to see a substantial US and EU recession, if only to punish us for our support of Ukraine. China, in contrast, likely recognizes that its economic health is in part predicated on US economic health.
My perspective is that the probability of a recession is very close to a coin flip. If you want to make your own prediction, you need to answer two questions. (1) How aggressively and how long will the Fed continue to pursue contractionary policy? My perspective is that the MB will continue to be gradually reduced while we are at or near the end of rate increases. (2) Will Russia’s or China’s actions change? I’m an economist so I’ll leave predictions there to the political scientists.
Impact on Deposits
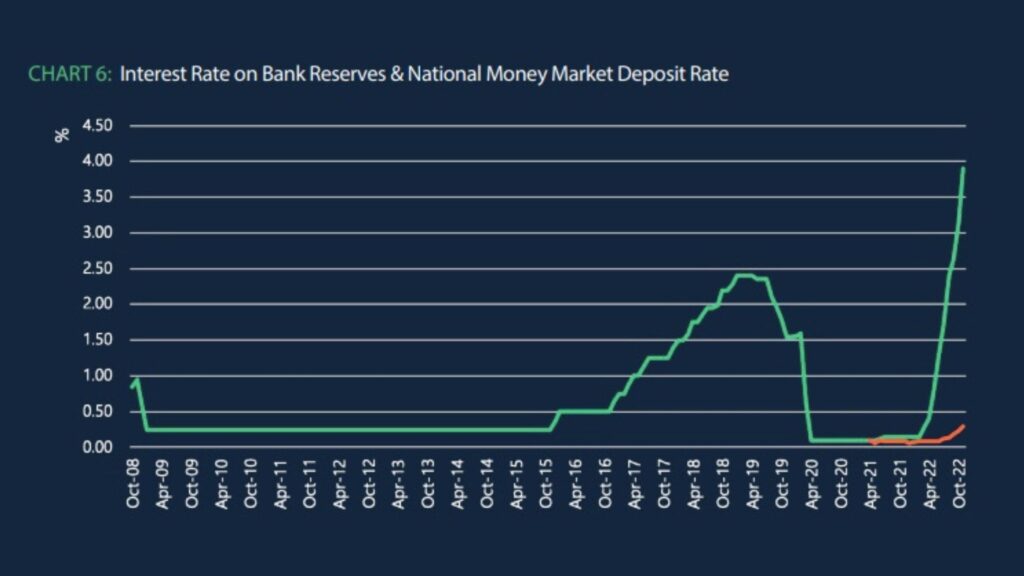
In previous quarterly reviews, I have emphasized two points for deposits. First, modest economic growth is the most likely scenario for at least the next quarter or two, and modest economic growth is consistent with modest deposit growth. And second, the Fed’s policy of reducing the MB suggests that reserves will drop and that deposit growth will slow from its previously high levels. I continue to think that remains the most likely scenario. There is, however, one important change in the calculations of the value of deposits. Historically there was no interest paid on bank reserves. That changed at the beginning of the financial crisis in mid-2008 with the Fed paying a rate based on the Fed funds rate. For most of the period since the funds rate has been near zero; thus, the rate paid on reserves was also near zero. The implication is that holding reserves was not profitable for most financial institutions. However, as the Fed has increased the funds rate, it has also increased the rate paid on reserves, and that rate is now 3.9%. That rate increase implies that the valuation of bank reserves and thus bank deposits have changed, perhaps substantially, depending on the institution. My last chart plots the rate paid on reserves together with a new series charted by the Fed, the national average money market rate (MM). What is notable is changes in the spread between the MM rate and the rate paid on reserves. Early this year, those rates were about 10 bps, yielding zero spread. Currently, that spread is about 3.7%. The implication is that while bank reserves have fallen as indicated by Chart 3, the value of those reserves has increased substantially. Given the stickiness of bank deposit rates at most financial institutions, even if the funds rate is not increased further, that increase in the value of reserves and deposits is likely to remain.
About MountainView Risk & Analytics
For over two decades, MountainView Risk & Analytics, A SitusAMC company, has helped clients accurately forecast outcomes and make balance-sheet decisions through an integrated methodology and advanced statistical modeling that incorporates a multi-layered, institution-specific analysis. We assist clients in developing credit risk, model risk and enterprise risk strategies and infrastructures to achieve optimal profits, as well as assessing and quantifying the various risks embedded within the organization. Our team collaborates with clients and provides insights and best practices from engagements across the country, bringing this knowledge to bear on every assignment to assist clients in their business needs. If you would like to learn more about working with MVRA please submit a request to connect today!