
Commentary provided by Dr. Richard Sheehan, Economist
There is an old curse, allegedly Chinese but more likely English, “May you live in interesting times.” From a macroeconomist’s perspective, the periods around the financial crisis and now Covid and its fallout constitute the most interesting times in many people’s lifetimes. Is inflation going to be with us for a prolonged period of time? Are we in a recession or moving towards a recession? Have fiscal and monetary policies contributed to the problems or served to mitigate the problems? Compounding the confusion, the press – including the financial press – has too often adopted “the sky is falling” approach to address the issues.
The short summary: economic data indicates extremely interesting times given that economic indicators are giving incredibly mixed signals, but there is no signal that the sky is falling. Perhaps the key to understanding current economic events is “nuance” and a careful examination of macro data.
First, are we in a recession? The standard rule of thumb used to define a recession is two quarters in a row of negative growth. Aren’t we there since the preliminary estimate of second-quarter real GDP growth was -0.2% following a -0.4% rate in the first quarter? The preliminary numbers, however, are subject to potentially substantial revisions as additional data becomes available, and the initial estimate could easily turn positive with that data. The first quarter’s initial estimate of -1.4% was revised upward to -0.4%.
More importantly, it is a committee of the National Bureau of Economic Research (NBER) that dates recessions, and GDP is not generally considered one of their primary measures of interest when determining a recession. Why not? Because the NBER dates recessions by month rather than by quarter and GDP is only reported quarterly. The NBER can consider any series it desires as a potential recession indicator. Series like personal income excluding transfers, nonfarm employment, retail sales, and the Federal Reserve’s index of industrial production have all been considered important variables. In addition, the NBER is under no pressure to “call” a recession ASAP. Their goal is to get the date correct rather than make a quick call. The NBER did not call the start of the Great Recession until late 2008 then determined that the recession began in December 2007, almost a year earlier. Based on that call and the underlying data, it appears that unemployment was likely the most important factor underlying that decision.
The implications for whether we are in a recession today are clear. To understand the state of the economy it is critical to go beyond GDP. The following two charts, one looking at the labor market and the other looking at production and retail sales, present far from a full picture, but they give a better perspective on the types of factors appropriately considered when determining the state of the business cycle.
Chart 1 presents both the unemployment rate (UR) and the annual percentage growth rate in employment. The data suggests that we are neither in a recession nor likely heading into a recession. The unemployment rate has been steady at its lowest recent level, 3.5%, the same as its pre-pandemic level. Employment growth remains strong with a year-over-year growth rate of over 4%. The labor force participation rate, not presented, is down but that is due to a decrease in participation of the over 55 age group. Neither series suggests a recession is near.
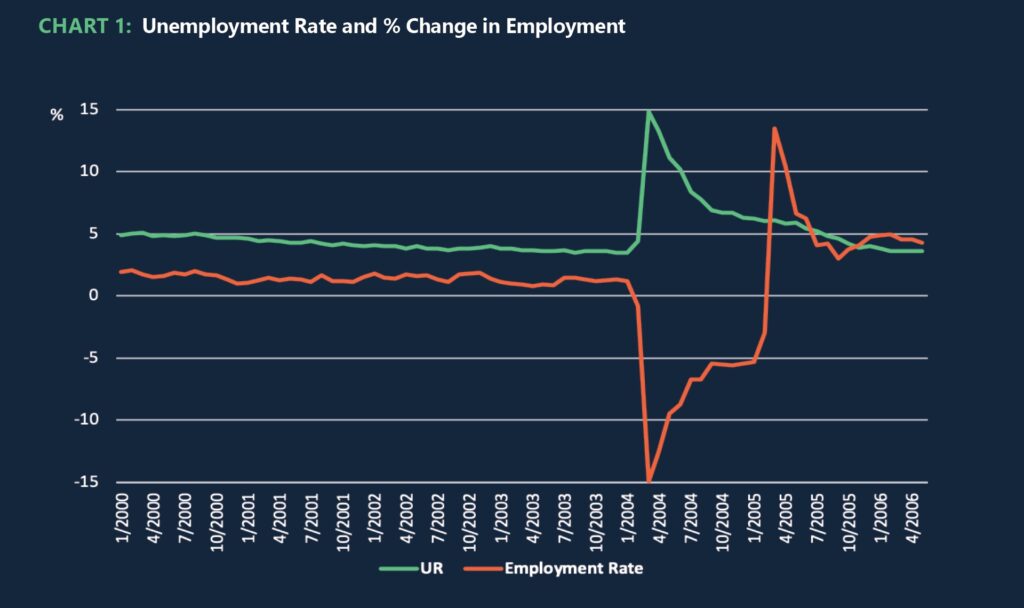
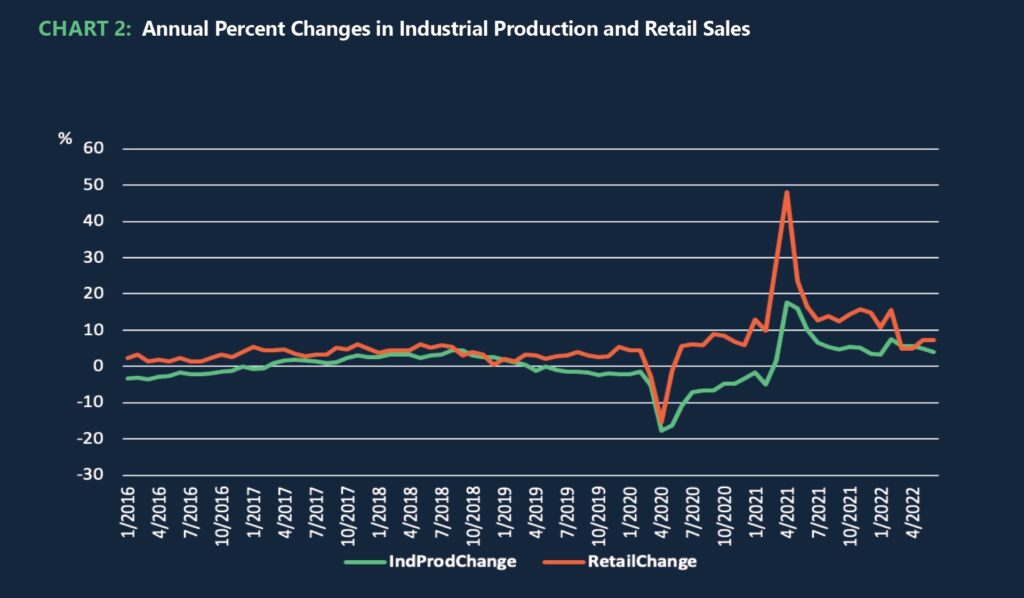
Chart 2 presents the annual percentage changes in industrial production and retail sales. Retail sales growth has dropped dramatically from about 15% down to about 7%. However, the higher growth rate was clearly unsustainable – and the prior positive spike is a statistical anomaly arising from the drop in the numbers caused by Covid. Were retail sales continue to decline, that would suggest a potential recession, but there is little evidence that will occur, and 7% remains very strong growth. Industrial production took a relatively long time to recover from Covid, but recent growth also has been strong. There is some indication that growth there also is slowing. But even June’s 4% growth exceeds the highest growth rate from 2016 through 2018 of just under 3%. Slowing growth is a potential concern but the question again arises whether a 4% growth rate in industrial production is sustainable in the long run.
The bottom line from these indicators is that the current evidence supporting either the view that we are currently in a recession or that we are heading into a recession is remarkably limited given how much discussion the topic has received. Should there be concerns? Definitely. While the U.S. economy appears to be in relatively good shape, the same cannot be said for Europe or China. The former’s problems appear due primarily to energy concerns arising from the Ukraine-Russia war, and the latter’s slower growth arises primarily from China’s continuing shutdowns due to Covid. Even in the U.S., there are indicators that suggest weakness, e.g., the University of Michigan’s index of Consumer Sentiment is lower now than it was during the Covid shutdowns. In sum, however, the U.S. economy is in much better shape than most other economies and appears better able to weather any coming economic storms.
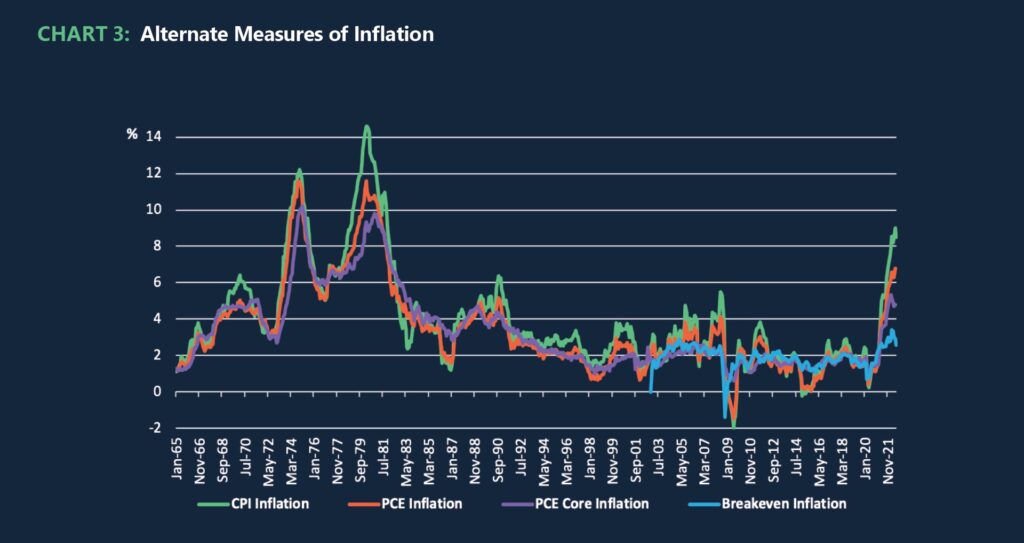
Turning to inflation, Charts 3 and 4 present the data on multiple inflation measures. The headline inflation rate is the Consumer Price Index (CPI), in part because it is used as the index to adjust Social Security benefits. In Chart 3 CPI shows the most aggressive increase of any of the measures. This increase is largely due to dramatically higher oil prices and thus higher prices of any oil derivatives, primarily gasoline and any product with substantial transportation costs. As the price of gasoline has come down, we see the hint that inflation has likely peaked and is likely on the way down. It is important, however, not to look solely at the overall CPI but to consider the Personal Consumption Expenditures (PCE) and to exclude the price movements stemming from the idiosyncrasies of oil prices, i.e., focus on core inflation. Chart 4 presents four measures of inflation, CPI and PCE, and both standard and core inflation rates. Also included is an indicator of inflation expectations, the spread between the nominal and real 5-year Treasury bond, referred to as the breakeven rate of inflation.
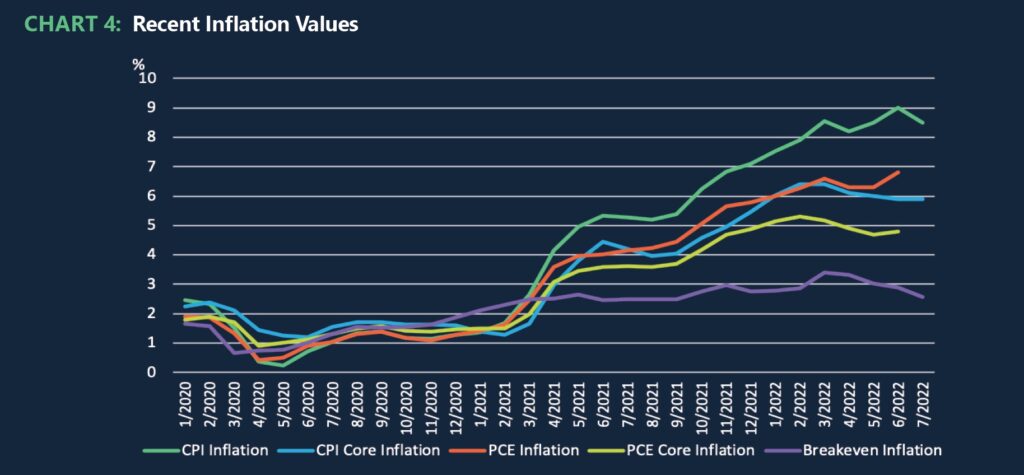
Through early 2021, all four measures of actual inflation indicated about a 2% rate of price increase, and then all four direct measures indicated a substantial increase in inflation, probably because vaccines became widely available then and aggregate demand increased as the economy opened up, consistent with the increase in Retail Sales presented in Chart 2. A substantial gap opened up between CPI and PCE at this time. We can debate which measure of inflation is best, with the Federal Reserve choosing PCE as its preferred measure. But there should be little debate that we did have an acceleration of inflation and that accelerating inflation appears to be over. The increase in inflation and now the decrease in inflation should not be a surprise and correlates closely with macro variables like Retail Sales.
Frankly, I was surprised at how aggressively prices increased with the surge in sales. But given the return of the economy to more normal values for series like retail sales and overall consumption, I believe that the surge in inflation will be only temporary. While I would like to say that price increases would quickly return to their prior 2% level, the data suggests that result is unlikely. Based on the breakeven inflation rate, which is predicated on market expectations of inflation, the best forecast for inflation 5 years down the road is close to 2%. That decline, however, likely will be slower than we might wish.
Can we identify a culprit for the increased inflation? Too much expansionary monetary policy and too much expansionary fiscal policy have been fingered as responsible. The data, however, rejects both contentions. The timing for expansionary policies does not match the increases in inflation. Monetary policy has not been expansionary since November 2021 with the monetary base (MB) shrinking by about $400 billion since then as indicated in Chart 5. The Fed’s recent rate increases have garnered more headlines in terms of policy actions, but the reduction in the MB likely has had more impact in slowing inflation – and likely also will have more impact on the overall level of deposits. The reduction in MB is a move directly out of Milton Friedman’s handbook on how to reduce inflation.
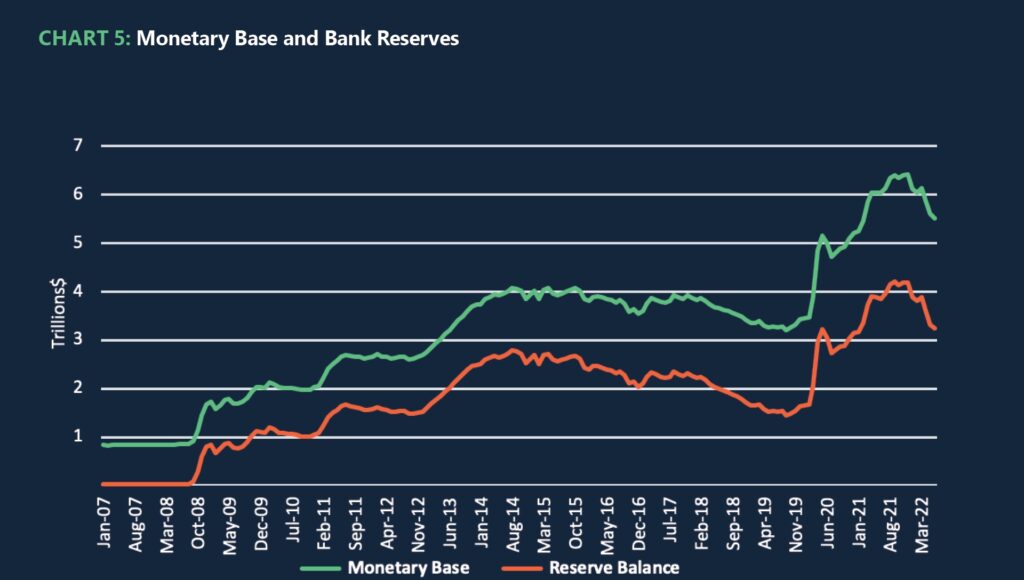
If someone wants to argue that increases in the monetary base have generated inflation with a lagged impact, they also need to address why we did not experience similar increases in inflation with similar increases in the monetary base after the Great Recession. Increases in the monetary base have the potential to substantially increase inflation – if there is overall excess demand in the economy. However, the data indicate that we have been operating below capacity, although relatively close to full employment. The Fed’s actions, recently reducing the monetary base, in particular, suggest that it is trying to thread the needle, keeping the economy close to full employment but not pushing the economy beyond full employment and generating inflation.
There is a concern in some quarters that the dramatic rate increases will slow the economy so significantly that we will not have a soft landing and will have a recession. That result appears unlikely. The Fed has increased the federal funds rate by 2% in a very dramatic fashion. That increase has been reflected in short-term rates, but it has not been reflected in long-term rates. Since April 2022, the funds’ rate increased by 200 bps, but the 10-year Treasury rate declined by 22 bps. That has led to a dramatic flattening of the yield curve. The 1-year Treasury rate is now above the 10-year, 2.98 vs. 2.67 for July. An inverted yield curve is sometimes taken as a leading indicator of a recession. In this case, that appears to be a misreading of the data. For reasons stated above, the increase in short-term rates is likely more a signal of the Fed’s seriousness in dealing with inflation than with the actual conduct of monetary policy as better captured by changes in the monetary base.
Turning briefly to fiscal policy, was expansionary fiscal policy a primary cause of inflation? Again, the timing is off. Government expenditures increased considerably with the onset of Covid and government-mandated shutdowns. But over the past year, Federal government expenditures have increased by 5.5% while consumer expenditures have increased by 8.4%. Consumer expenditures also start from twice as large a base. Higher government expenditures may have played a role in generating inflation, but compared to the role consumers played, the Federal government’s role was relatively small. The bottom line is that neither monetary nor fiscal policy likely played any more than a minor role in generating the recent spurt in inflation. The household sector should get the credit. The cartoonist Walt Kelly states it correctly. “We have met the enemy and he is us.”
Where do we stand and where are we going? Summarizing the current situation:
- While GDP growth is potentially worrisome, other economic indicators suggest continued moderate economic growth.
- The U.S. economy is likely the strongest major economy in the world, not just in terms of overall size but in growth and in the ability to withstand further shocks. The fact that other economies are relatively weak, however, will likely reduce U.S. net exports which should serve as a limiter both on U.S. growth and U.S. inflation.
- Inflation has picked up over the past year but appears to have peaked, perhaps as early as March 2022. The sum of macro evidence indicates that the surge in inflation is temporary.
- The Fed has made dramatic moves by increasing interest rates but has made more important contractionary moves by reducing the monetary base.
- Fiscal policy has been of minimal importance from a macro perspective over the past year.
Looking ahead in the short-term on the macro front:
- We should expect roughly similar or slightly slower growth because the Fed has prioritized slowing inflation over continued aggressive growth and because other economies are growing more slowly thus limiting our export potential.
- Inflation is likely to continue to decline at least in part because the Fed is committed to reducing inflation. That process, however, could take more time than I would like because of factors like limited oil production and the stickiness of prices downward.
- The first two implications in turn suggest that we may be facing a period of stagflation, that is, both slower growth and higher inflation than we would like. That result would suggest a growth rate of perhaps 1.5-2% and prices increasing 3-4%. That result appears more likely than either a recession or a continued higher inflation rate.
- While short-term interest rates have climbed dramatically because of recent Fed actions, further aggressive interest rate actions by the Fed appear unlikely assuming that inflation rates continue to fall, even if only slowly.
The macro implications for deposit growth and deposit rates are straightforward:
- Modest macro growth by itself suggests modest deposit growth and will not impact deposits in a meaningful fashion.
- High inflation likely would lead to reductions in deposit growth since the return on most deposit categories would be less attractive. Holding deposits would have a greater opportunity cost, both in terms of depositors choosing higher-yielding assets or even spurring purchases in advance of higher prices. Even a gradual weakening of inflationary pressures is likely good news for stronger deposit growth.
- Excess reserves will likely continue to drop as the Fed reduces the monetary base, thus reducing bank deposits. What happens at an individual institution could vary widely depending on the types of deposits held, with money center banks probably the most impacted.
- Deposit rates are likely to move only slowly for the overwhelming majority of financial institutions. With substantial excess reserves remaining in the system, banks have little incentive to compete for funds. If economic growth is only modest, then loan growth is also likely to be modest. And without strong growth in loan demand, generating additional deposits would not be a priority item for most institutions. In addition, most financial institutions now understand that deposits generally are not highly rate sensitive, with few exceptions, further reducing the need or desire to aggressively increase deposit rates.
About MountainView Risk & Analytics
For over two decades, MountainView Risk & Analytics, A SitusAMC company, has helped clients accurately forecast outcomes and make balance-sheet decisions through an integrated methodology and advanced statistical modeling that incorporates a multi-layered, institution-specific analysis. We assist clients in developing credit risk, model risk and enterprise risk strategies and infrastructures to achieve optimal profits, as well as assessing and quantifying the various risks embedded within the organization. Our team collaborates with clients and provides insights and best practices from engagements across the country, bringing this knowledge to bear on every assignment to assist clients in their business needs. If you would like to learn more about working with MVRA please submit a request to connect today!