
The best way to characterize my view of the economy is one of cautious optimism. GDP continues to grow at a moderate rate; the unemployment rate has fallen sharply while employment has risen dramatically; consumption and retail sales are relatively strong, and monetary and fiscal policies remain expansionary. But the economic indicators are not unambiguously positive. If you want to put a negative spin on the direction of the economy, it is pretty easy to do so. Economic growth last quarter was relatively weak while GDP remains well below its potential; the labor force participation rate remains low, and concerns about supply shortages and potential inflation are the top news stories. Can we put these items in context and ask what are the implications for financial institutions deposits?
The best place to start is to look at GDP, the broadest common measure of economic activity. Chart 1 shows both actual and potential real GDP and includes data for the last three recessions in 2012 dollars. The COVID-related recession is dramatically more severe than the prior two and the recovery is substantially quicker. But there also appears to be a common trait across the three recoveries that should be a cause for concern: the length of time required for actual GDP to return to its potential. In the Great Recession, the economy bottomed out in 2009:2 but didn’t return to its potential until 2017. And even with the weak recession from the Dot-com bubble in 2001, the economy didn’t return to its potential until 2004:1. With the current recession, much of the gap between actual and potential GDP was eliminated quickly. That result should not be surprising. The huge drop was largely due to major sectors of the economy shutting down to combat the virus with GDP picking up when those sectors reopened. After that, however, the speed of the closure of the potential/actual gap has slowed considerably. Based on prior experience, it could take years to fully close that gap.
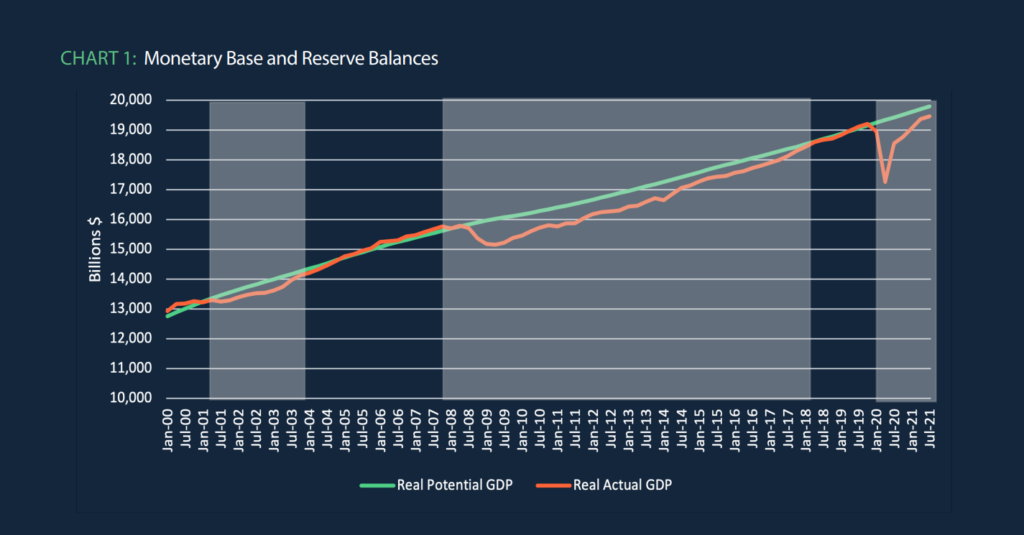
To fully understand what is going on, it is important to consider what is happening to the components of GDP including consumption, investment, and net exports. Consumption comprises about 70 percent of GDP and has fallen and risen roughly apace with GDP. Investment fell relatively little and is now above pre-COVID levels. Net exports, however, are down by over $0.5 trillion at an annualized rate. This change in the trade deficit should not be a surprise. The U.S. recovery has been stronger than much of the rest of the world, at least in part because we had early access to vaccines. But that earlier recovery spurred consumer spending in part on imports while rest-of-the-world income remained low and demand for U.S. exports correspondingly remained low. This area of weakness is not something that can be easily remedied through standard fiscal or monetary policy. For the U.S. economy to quickly close the gap between actual and potential output, it is likely that consumption and investment will have to pick up the slack, at least in the short run. In turn, that suggests that monetary policy will likely remain expansionary for the foreseeable future, even when Quantitative Easing (QE) ends.
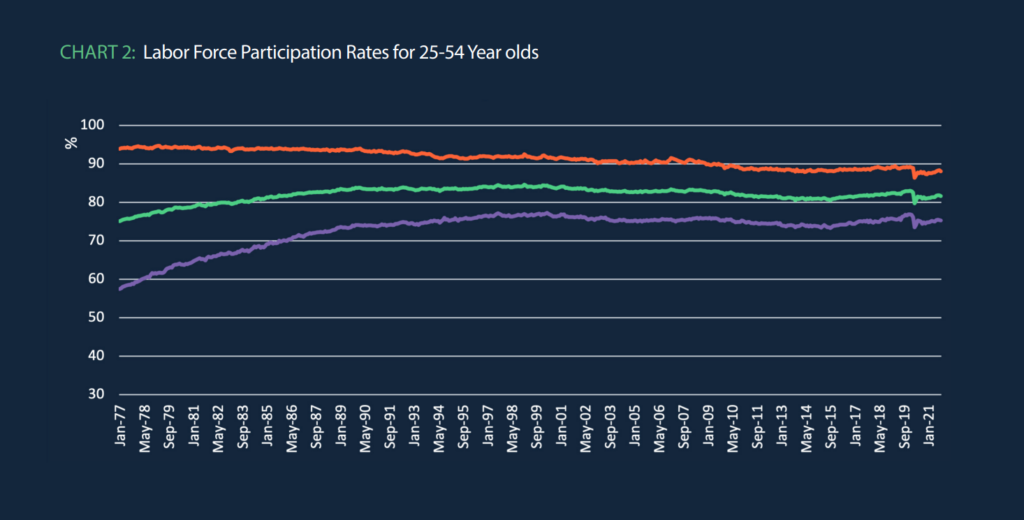
The unemployment rate is perhaps the second most used economic indicator and it has been on an aggressive downward trend since April 2020. In October it declined to 4.6 percent suggesting that the economy is moving quickly towards full employment. Labor force participation rates (LFPR), presented in Chart 2 for individuals 25-54, however, suggest a slightly less rosy scenario. Labor force participation rates tend to change slowly and be driven by socio-economic trends and not by the business cycle, and the chart indicates this pattern. The only dramatic change occurred at the outset of the pandemic. April 2020 shows a sharp decline in LFPRs. It is common to ascribe the pandemic-related decline in LFPR’s to a drop in female labor force participation. Chart 2 indicates this view is an overstatement. Men’s LFPR dropped by 2.9 percent while women’s dropped by 3.4 percent. There was a gender gap, but both series show similar drops, similar recoveries, and a continuing upward trend. What explains the apparent labor shortage and the current ubiquity of Help Wanted signs? The answer lies largely in a group not included in Chart 2 – those 55 and older. Pre-pandemic, their participation rate was 40.3 percent; post-pandemic their participation rate is 38.5 percent and has shown no sign of recovery. This result shouldn’t be a tremendous surprise. The mortality rate due to COVID rises dramatically with age, and it appears that older workers have factored that into their decisions to remain in or to leave the labor force. Their drop-in LFPR has removed over 2 million workers from the labor force who may never return to work. The implication is that labor shortages in some areas are likely to continue, potentially for a long time. Those shortages in turn could prompt wage increases which could generate inflation.
I have been optimistic that inflation is not in the cards. Nevertheless, there are two schools of thought about inflation at least in the short term. One argues that (1) increasing demand, seen in the growth in GDP and consumption, plus (2) the labor supply shortages and (3) the highly expansionary month growth indicates that higher inflation is inevitable. The other contends that (1) actual GDP remains well below potential GDP indicating we do not have excess demand, and (2) supply shortages are largely temporary are reflect breakdowns in supply chains, and (3) the Fed is deeply invested in avoiding any surge in inflation. Combined, these factors imply that inflation might increase somewhat in the short term but is unlikely to change appreciably in the long term. I have been in the latter camp, although I do have some concerns with the supply chain.
My logic is, first, what matters most is not whether demand is increasing or decreasing but whether we are near or approaching full employment versus at or beyond full employment. Chart 1 indicates that the former is the correct view. In addition, the U.S. is closer to full employment than most other countries, and there appears to be worldwide excess capacity, supply chain breakdowns notwithstanding. Notably, China’s economic growth appears to have slowed substantially.
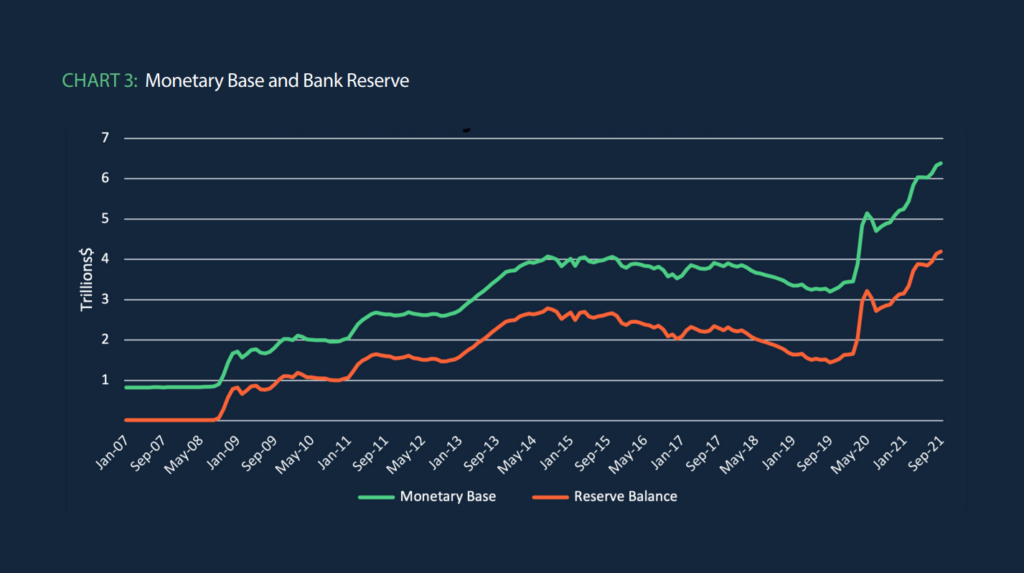
Second, while monetary policy has been highly expansionary, the Fed also has done a superb job in restraining inflation. Chart 3 presents the growth in the monetary base and in bank reserves. That rapid growth in the monetary base (MB) should generate concern about inflation in normal times – but these are far from normal times. If we consider the period after the financial crisis, we see three spurts in the MB corresponding to three iterations of QE. By mid-2014 the Fed had begun to gradually unwind those positions. And throughout this period, we witnessed no inflationary spiral. QE was designed to provide liquidity to the financial system and to do so without generating inflation. It’s hard to argue that the Fed was not successful in that endeavor. Moving to the COVID period we see an even more massive QE which the Fed has indicated is being gradually phased out and will end in July 2022. That does not mean that interest rates will rise, only that the rapid growth in the MB and in bank reserves is likely coming to an end. Again, considering the fallout period after the financial crisis, QE ended long before the Fed began to increase interest rates and it is likely that the Fed will follow the same approach this time around. But to bet that inflation will rise is to bet that the Fed will err in its conduct of monetary policy. That’s not a bet I’m taking.
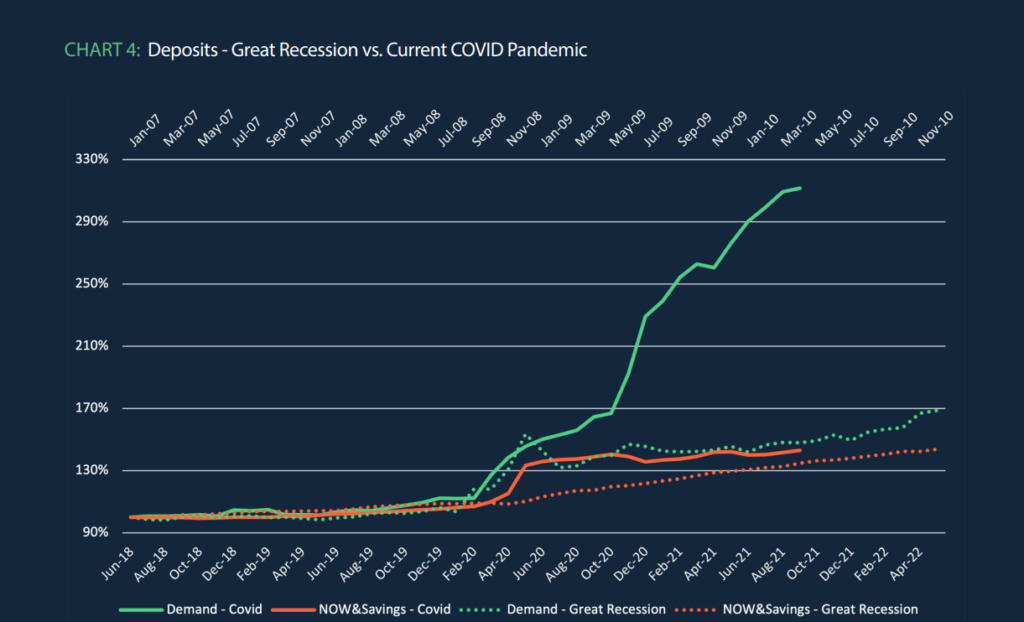
Finally, what does this analysis imply for Financial Institution deposits? Chart 4 updates the comparison of deposit growth for the Great Recession versus the Covid-19 crisis. The graph stops before the beginning of the phaseout of QE but still shows a slowdown in demand deposit growth. This slowdown is likely to continue but it is likely that the level of demand deposits will remain well above its historical level. Other deposits also are above their historical values but with a decreasing growth rate and those trends also are likely to continue. At some point, the Fed will likely begin to unwind its QE positions and interest rates will increase. That time, however, is unlikely to occur until late 2022 at the earliest based on the Fed’s behavior after the Great Recession. Until then, it appears that we are in a holding pattern on interest rates and deposit growth rates.
I have typically concluded this market snapshot with a perspective on things that could go wrong. Perhaps the best news here is that the list looks less formidable now than it has recently. The Delta variant of the virus appears to have run its course – although the winter months could bring a Covid resurgence and another economic slowdown. Trade issues with China remain unaddressed but China appears to be having greater issues with internal growth. And of course, supply chain issues are a continuing concern. Nevertheless, while the world economy is still far from back-on-track, the greater worldwide availability of vaccines suggests that a return to more normal times may be on the horizon.
About MountainView Risk & Analytics
For over two decades, MountainView Risk & Analytics, A SitusAMC company, has helped clients accurately forecast outcomes and make balance-sheet decisions through an integrated methodology and advanced statistical modeling that incorporates a multi-layered, institution-specific analysis. We assist clients in developing credit risk, model risk and enterprise risk strategies and infrastructures to achieve optimal profits, as well as assessing and quantifying the various risks embedded within the organization. Our team collaborates with clients and provides insights and best practices from engagements across the country, bringing this knowledge to bear on every assignment to assist clients in their business needs. If you would like to learn more about working with MVRA please submit a request to connect today!