
The state of the economy looked strong last quarter, and that general outlook continues. GDP is growing at a relatively rapid rate and has almost returned to its pre-pandemic level – $18.8 trillion vs. $19.0 trillion in real terms. The NBER stated that the recession has officially ended after only two months, making it the shortest on record. Just a year after the unemployment rate was in double digits, it is currently down to 5.9 percent, a level not achieved until over five years after the Great Recession. Interest rates remain low and fiscal policy appears to remain expansionary. But as last quarter’s summary notes, storm clouds linger that could easily derail a strong economic recovery.
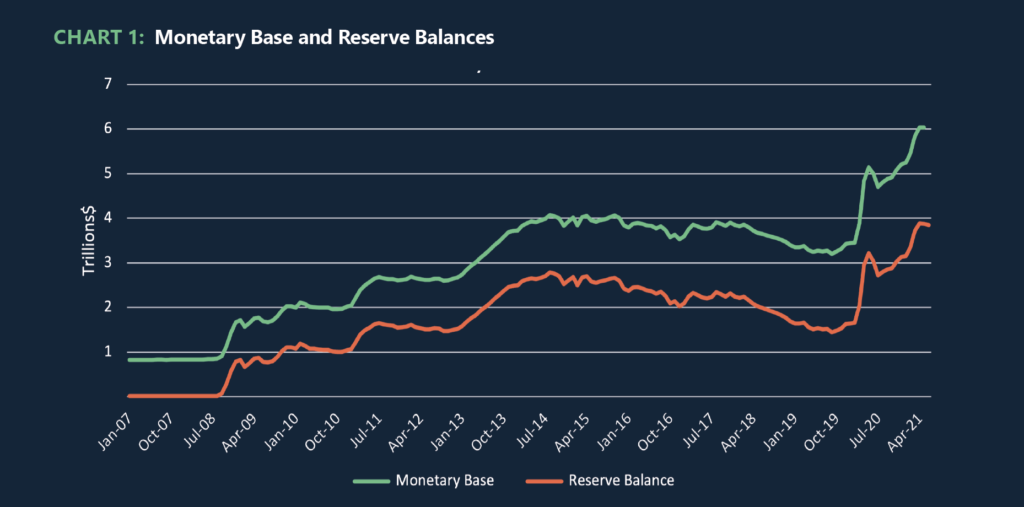
Let’s begin by focusing on the positives, as they relate to deposits, deposit growth, and profitability of financial institutions in general. Since the pandemic first appeared on their radar, the Federal Reserve policy has been expanding at an unprecedented rate, even more expansionary in some dimensions than during the Great Recession. Chart 1 shows how the monetary base and reserve balances have changed, in both the Great Recession and the Fed’s response to COVID-19. To deal with the Great Recession, the Fed’s primary actions were three rounds of Quantitative Easing (QE), which did not reduce interest rates, since short term rates (like the Federal Funds rate) were only marginally greater than zero. The goal was to provide additional liquidity to the financial system, and the Fed increased the monetary base by about $3 trillion over a six-year period. In contrast, with COVID-19, the Fed increased the monetary base by “only” $2.6 trillion, but did that in just 15 months.
Both Fed increases in the monetary base generated substantial concern about the impact on inflation, the concern being that too much money would chase too few goods. The Fed is all too aware of that potentiality; during the late 1970’s and early 1980’s Fed actions were partially responsible for double digit inflation rates. After the Great Recession, when the economy was on its way to recovery, the Fed switched gears and began to gradually unwind its huge bond position. That process continued through 2019. Chart 2, which tracks inflation back to the 1960’s, indicates that there was no increase in inflation, even with the dramatic increase in the monetary base when the Fed was dealing with the Great Recession. The chart also suggests that the Fed has not done a good job on inflation at certain points in the past.
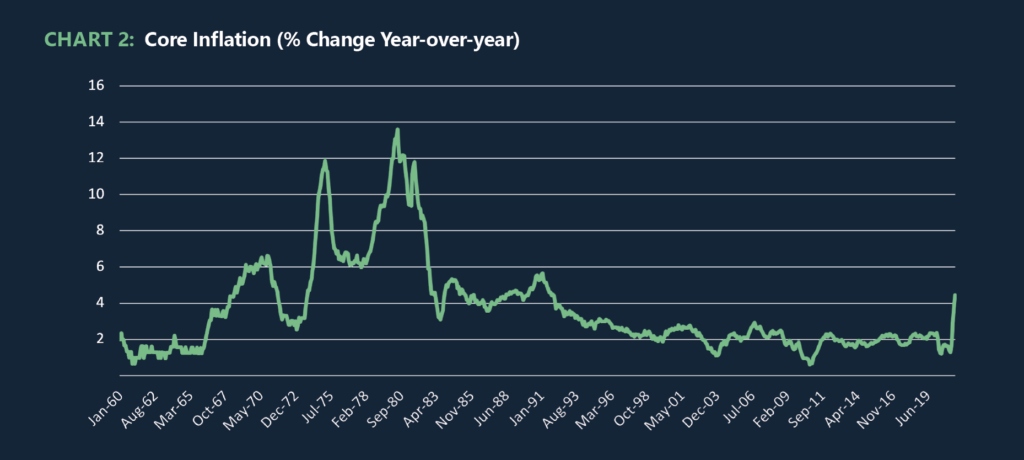
Chart 2 also indicates a troubling surge in prices that, to many analysts, suggests that higher inflation is on the horizon. However, there are multiple reasons why this concern may be misplaced. First off, the current spurt is partially artificial since it looks at year-over-year price changes. This time last year, with many businesses closed due to the pandemic, prices were artificially low. Thus, elements of the spike at the end simply reflect the return to normal pricing.
Secondly, the current spurt is partly due to supply chain problems, for example, price increases in lumber, automobiles, and computer chips. These changes are likely temporary rather than permanent and should have little impact on inflation overall. Thirdly, the Fed is keenly aware of how its actions potentially impact the economy, including the repercussions on inflation. If we glance back at Chart 1, the Fed has clearly taken its foot off the accelerator for the past three months: the monetary base is very high but has not increased. The Federal Reserve is not likely to raise interest rates, at least for the remainder of this year and into the next, but the lack of continued growth in the monetary base over the past three months suggests that they are adopting a more conservative approach. This could be attributed to a belief in the measures taken thus far that have kept the economy going, rendering further extensive monetary expansion unnecessary, especially if fiscal policy turns more expansionary, or consumers become more comfortable in life returning to a pre-pandemic level of normalcy.
Lastly, when in doubt, we ask the question “what do those who have large dollar bets on inflation believe?” One of the best indicators is the spread between 10-year Treasury rate and the 10-year Treasury Inflation Protected Security (TIPS) rate. If you believe that inflation will spike up, you should be buying TIPS and selling 10-year Treasury bonds. Chart 3 presents that spread. We see two big downward spikes at the onsets of the Great Recession and the COVID-19 pandemic. From the recent low we do see an appreciable increase, but that increase only moves us back to the average rate pre-Great Recession. Those betting on what the inflation rate will be over the next ten years come in at about 2.3 percent.
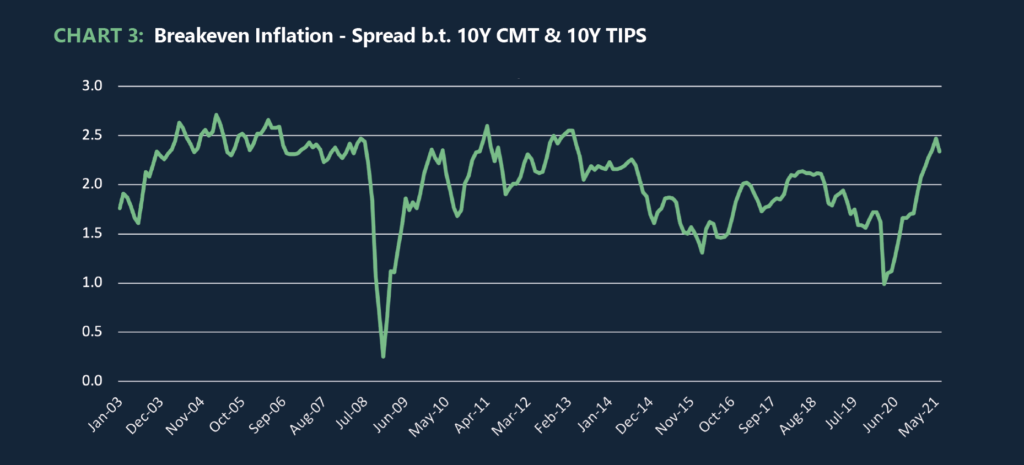
Could we have a resurgence of inflation? Absolutely. The Fed performed poorly in controlling inflation in the late 1970’s and early 1980’s, and played a major role in exacerbating the Great Depression – proving they can make mistakes. But very recently, the Fed managed a substantial increase in the monetary base without triggering inflation. Both the Fed and macroeconomists in general have learned much about the roles the Federal Reserve can and cannot play. Betting that the Fed will not competently manage the most recent increase in the monetary base does not appear to be a smart move and is consistent with Chart 3. Why does this matter for deposits? While the impact of inflation on deposits is ambiguous it is also potentially extremely important; both for the level of deposits and for institutional profitability. Higher inflation increases opportunity costs for holding deposits and all things equal would be expected to reduce deposits. To the extent that higher inflation also implies higher interest rates – and that the betas on deposit rates are generally substantially less than one – those deposits could become more valuable to the institution. In a similar vein, where the economy continues to grow and loan demand grows with it, some reduction in deposit growth and a drop in reserves would likely be good news for most financial institutions.
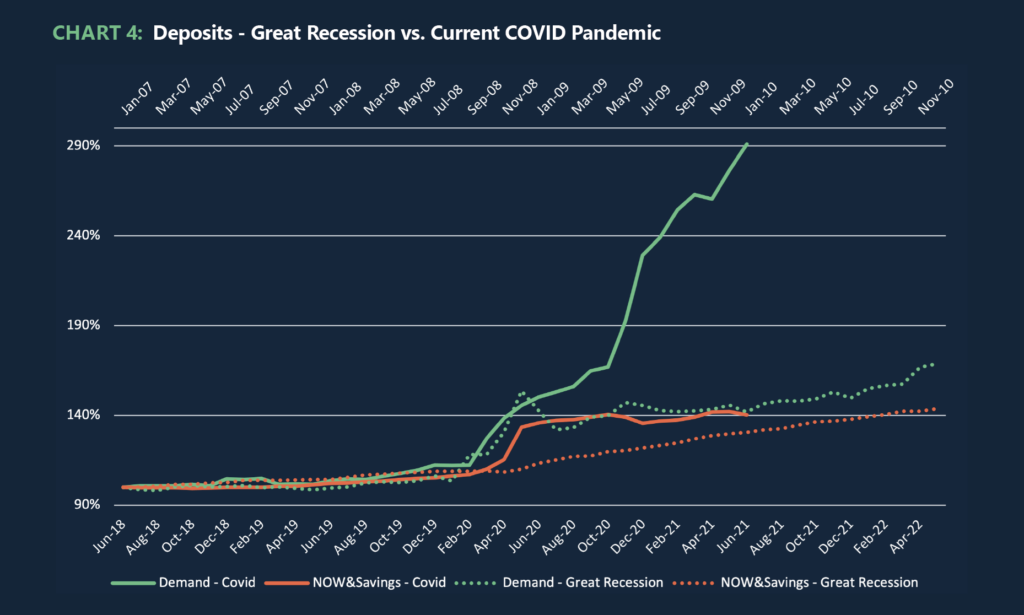
Chart 4 revisits aggregate bank deposit growth, once again comparing the Great Recession and the COVID-19 crisis. Negotiable Order of Withdrawal (NOW) and Savings deposits are now officially Other Liquid Deposits (OLD) since the Fed now allows unlimited check writing on savings and money market accounts. The chart suggests a large increase in OLD at the start of the pandemic, but part of this is due to the Fed dramatically increasing the monetary base, as well as reflecting the changing definition. Since then, there has been higher growth than previously in savings deposits, which is difficult to discern from the graph because the increase in demand deposits dwarfs everything else. With the slowdown of growth in the monetary base, we should also expect a slowdown in the growth of deposits. The level of deposits, however, is likely to remain well above historical norms.
My general view of our direction is continued strong economic growth; I am cautiously optimistic. Nonetheless, it appears that our current upwards trend is fragile for multiple reasons, and the Fed’s recent actions suggest that they have a similar perspective. When looking at what could derail our expansion, the most obvious item is the resurgence of the virus, in particular the Delta variant. That is a wild card that should temper any forecasts.
Similarly high on the list of concerns is the question of how the labor market continues to evolve. With half the states having already eliminated the additional unemployment benefits, and half continuing them, we can look at the early evidence to give us a clue about why the labor force participation rate remains low. States that have eliminated the payments have generally seen increases in their unemployment rates, while those that have retained the payments have seen general decreases. With unemployment rates and GDP growth highly correlated, that result suggests that eliminating the payments will not increase GDP, and the payments themselves are not the cause for lower participation rates. This interpretation is consistent with preliminary payroll data that shows greater growth in hourly worker employment in states that retained unemployment benefits over those that terminated them. However, an alternate view is that removing those payments led more people to start searching for jobs, potentially increasing the unemployment rate in the short term, but increasing GDP in the long run. It will take another few months to be able to reach any clear conclusion, other than the labor markets are in the process of undergoing dramatic changes. If the preliminary data holds up, it will indicate that increasing the labor force participation rate will become a major challenge and may depress economic growth.
Other concerns include continuing trade issues with China that do not appear to be improving; a question of whether supply chain disruptions will continue for a prolonged period; the magnitude of forthcoming fiscal stimulus; and the question of what further implications climate change has in store for the economy. None of these issues are easily addressed, hence my optimism is hedged with a large dose of caution.
Commentary provided by Dr. Richard Sheehan, Economist
About MountainView Risk & Analytics
For over two decades, MountainView Risk & Analytics, A SitusAMC company, has helped clients accurately forecast outcomes and make balance-sheet decisions through an integrated methodology and advanced statistical modeling that incorporates a multi-layered, institution-specific analysis. We assist clients in developing credit risk, model risk and enterprise risk strategies and infrastructures to achieve optimal profits, as well as assessing and quantifying the various risks embedded within the organization. Our team collaborates with clients and provides insights and best practices from engagements across the country, bringing this knowledge to bear on every assignment to assist clients in their business needs. If you would like to learn more about working with MVRA please submit a request to connect today!