
Commentary provided by Dr. Richard Sheehan, Economist
In the last couple of market summaries, I have begun by stating my overall view of the economy was one of cautious optimism. This time around I am more cautious and less optimistic. Most of the data remains positive, but there are more warning signs and areas of concern now. To summarize our current economic situation.
- The economy remains very close to full employment, despite the first quarter’s 1.4% drop in GDP, and the labor market remains robust with the unemployment rate down to 3.6% and its pre-pandemic level.
- Retail sales are very strong, and the index of industrial production has reached an all-time high.
- Inflation remains a concern but appears to have peaked.
- The Federal Reserve has switched to aggressively reducing inflation, with a 0.5% increase in the Federal Funds rate and a commitment to substantially reduce the monetary base.
As always, concerns remain. Russia’s war on Ukraine raises many risks including potentially destabilizing food and energy markets worldwide. COVID remains a concern, less now in the U.S. than in China. But China’s struggle with COVID and the Russia-Ukraine conflict both complicate resolving supply chain issues. Those tensions were with us before but have increased dramatically over the past few months. And growth in the rest of the world remains slow, reducing U.S. exports. But there’s a new concern that I must add to the list: a lack of confidence in the state and direction of the economy.
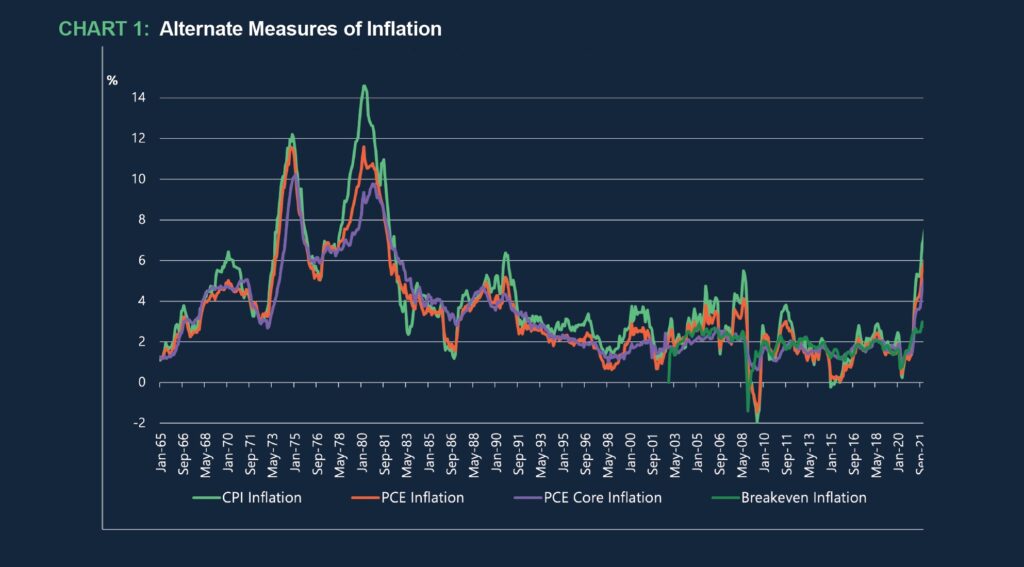
Let me begin with the concerns, starting with inflation. Chart 1 presents alternate measures of inflation. The most commonly used measure is the Consumer Price Index (CPI), to which Social Security benefits are indexed. The measure preferred by the Federal Reserve, however, is based on the Personal Consumption Expenditures (PCE) index. Excluding food and energy prices with their idiosyncratic shocks, their focus is on the core inflation rate, PCE-Core. The Fed’s target has been to keep price increases at 2% or less. The three series generally move closely together but the CPI is substantially more variable than the other two. Media focus has been on the CPI, but Chart 1 suggests that using that measure gives a different picture of the severity of inflation than what the Fed is using – CPI increasing by 8.6% in March (year-over-year), PCE increasing by 6.6% and PCE-Core increasing by 5.2%. All have increased substantially this year, and PCE-core is now well above the Fed’s target leading to aggressive Fed action to reduce inflation. But the Fed is focusing on an inflation rate that differs greatly from that which is widely reported.
Chart 1 contains one other series that I have also presented before, the Break-Even Inflation rate or the spread between a 5-year constant maturity Treasury bond (CMT) and a 5-year Treasury Inflation Protected Security (TIPS). This spread represents the expected rate of inflation over the next five years. While it has increased in the past few months, its increase is much smaller than other measures and is likely to decline substantially given the Fed’s recent contractionary policy steps. More on that shortly.
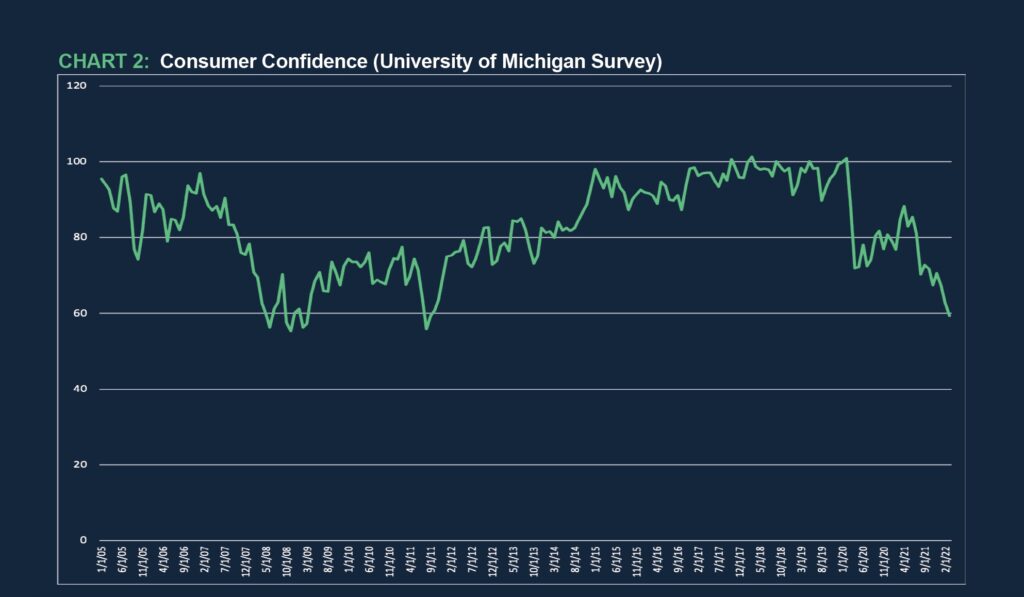
The second concern is with consumer confidence. While this item is difficult to measure, the University of Michigan has been collecting data on consumer sentiment since 1977. Chart 2 presents recent results. Not surprisingly we see a major fall in consumer confidence in the buildup to the Great Recession and we see another major fall at the outset of COVID. Between those two periods there was a gradual increase in consumer confidence. For the past year, however, we have seen what I would call a very surprising drop in consumer confidence. Does this drop suggest a recession is forthcoming? Other economic data are generally inconsistent with that conclusion, but the drop in consumer confidence is something to monitor going forward.
Looking at real GDP growth, the advanced estimate for the first quarter of 2022 showed a 1.4% drop in GDP, down from a 6.9% increase in the fourth quarter of 2021. At first glance, that would appear to be a major negative, but that report requires much more analysis. Personal consumption expenditures, by far the largest component of GDP, increased by 2.7%, and investment increased by 2.3%. So, what happened to cause GDP to drop? Government expenditures decreased by 2.7%, largely due to some COVID-related programs ending. But even that doesn’t explain the drop in GDP. Exports and imports were the most important in driving down GDP growth. Exports fell by 5.9% while imports rose by 17.7%.
These numbers should not be entirely surprising. The U.S. economy has performed extremely well over the past year with the unemployment dropping to pre-pandemic levels, the growth rate of retail sales exceeding pre-pandemic levels, and the Federal Reserve’s Industrial Production index reaching an all-time high. Meanwhile, the EU has generally struggled to maintain any positive growth. And China’s growth rate, while at 4.8% for the first quarter of 2022, is well below recent historical averages and is likely to decrease further until they stop shutting down large components of their economy in their efforts to maintain a zero COVID policy. Lower growth internationally has substantially reduced exports and will likely continue to reduce exports.
Turning to monetary policy, given the most recent drop in GDP, one might expect the Fed to be concerned about a potential recession. Deutsche Bank recently forecast a severe U.S. recession and a survey of economic forecasters indicated a 33 percent chance of a recession. Is it a possibility? Absolutely. Is it likely? No. The Fed just increased the target Federal Funds rate by 50 bps, the first time there has been that large an increase since 2000. That increase provides a clear signal that the Fed is most concerned with inflation and is not particularly concerned with causing a recession. In addition, it appears that the Fed is considering further increases in the Funds rate, possibly including another 50 bps increase. If the Fed was concerned about a recession, it is unlikely that they would have increased the Funds rate so aggressively or talked about further aggressive rate increases. While Fed actions suggest that they are not particularly concerned about the possibility of a recession, nevertheless their actions do increase the probability of a recession, although I concur with the Fed’s implicit conclusion that the probability of a recession is relatively low.
There are at least two complicating factors to this story, one suggesting that a recession might be more likely than the Fed expects and the other suggesting it would be less likely. Why more likely? Since 1988 there have been only three periods when the Fed increased the Funds rate by 50+ bps, February 1989, February 1995, and June 2000. Each time those rate increases were at the end of a period of rising funds rates, and after the 1989 and 2000 increases, the economy entered a recession within 18 months. That moves the needle at least slightly towards a higher probability of a recession.
Why less likely? Ukraine vs. Russia. War is expensive and increases the demand for armaments. Even though the U.S. is not directly involved, it provides substantial assistance in weaponry and humanitarian supplies. Those provisions, whether donated or purchased, will need to be replaced. As long as your infrastructure is not being destroyed, war is an economic stimulus making a recession less likely.
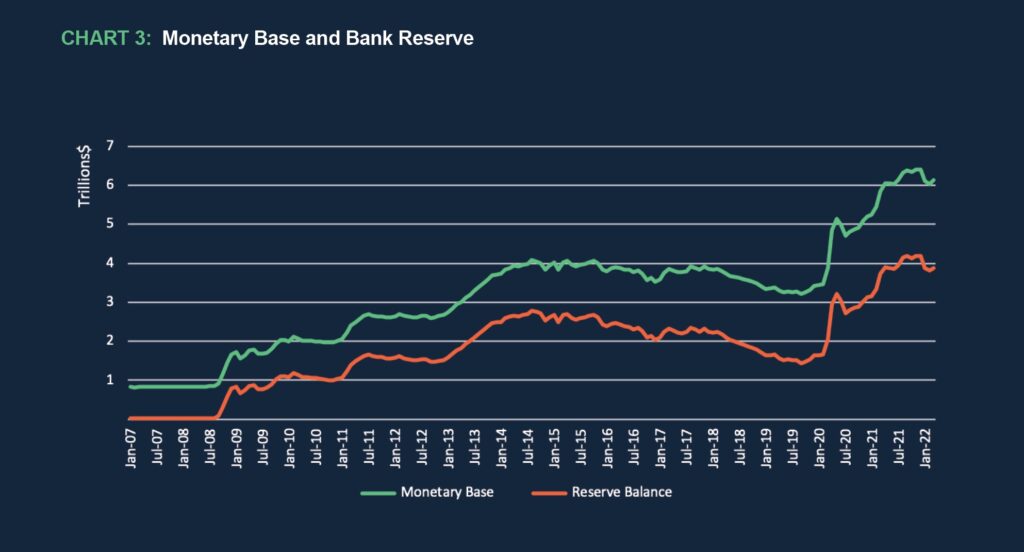
The Fed’s actions, however, are not limited to increasing the Funds rate. The Fed also announced plans to reduce its asset holding, by $47.5 billion per month for the next three months and then by $90 billion per month. Those actions will gradually reduce the monetary base, another contractionary monetary policy move. Chart 3 updates the trajectory of the monetary base and bank reserves. In fact, there has been little growth in the monetary base or excess reserves in the past three months. But this move by the Fed should return the monetary base to the slow and steady decline that we experienced from late 2014 through 2019.
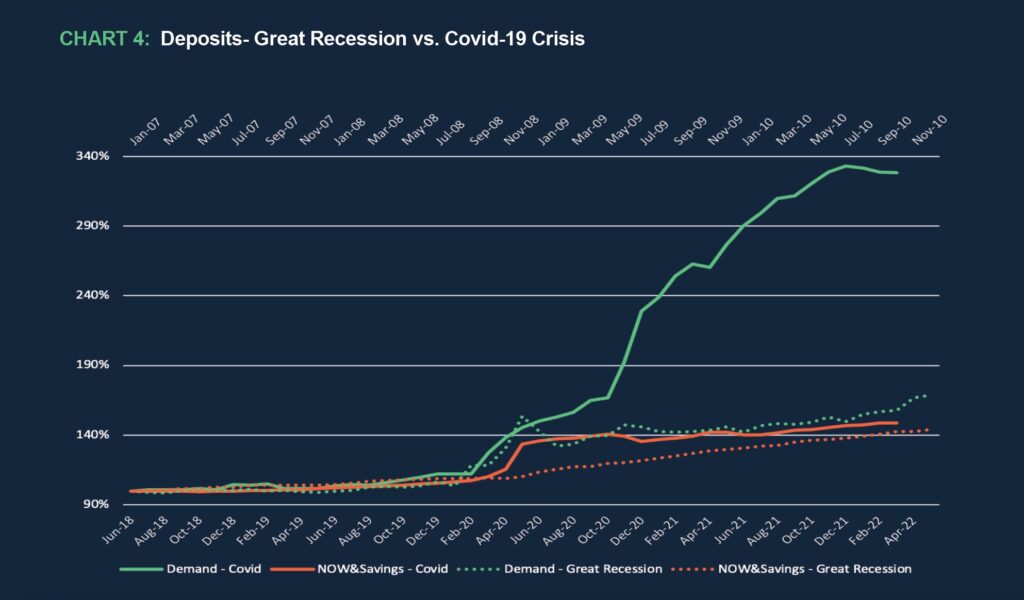
Finally, in terms of implications for deposits, Chart 4 updates our graph comparing the financial crisis with the COVID-19 crisis in terms of rapidly growing deposits. I have presented this graph, updated here, in each quarterly review, and it may be reaching the end of its useful life. As noted previously, the Great Recession saw a dramatic increase in both demand deposits and savings deposits (now other checkable deposits), but the pandemic has seen even greater growth in total deposits and in demand deposits in particular.
My conclusion last time bears repeating:
“There was much debate after the worst of the financial crisis was over concerning when or if those additional deposits were going to be withdrawn. My argument then was that most of them were not likely to be withdrawn. They were simply not “surge” balances. They likely reflected a long-term increase in the deposit base predicated on an increase in depositor uncertainty that generated additional deposits for liquidity reasons. For the financial system in general, that was the case. Should we expect the same with this further growth in deposits? If you think those deposits represent further uncertainty concerns, then bet on those deposits remaining in the financial system. If those deposits represent pent-up savings, then bet on them eroding over the next few years. Me? I am going with uncertainty.”
As the Fed begins to unwind its portfolio of assets, we should have a clear answer to the question of whether that increase in balances is permanent or transitory within the next six months. My expectation is that the preponderance of the increase in funds will remain as deposits – and that deposit rates will remain relatively low as a result.
About MountainView Risk & Analytics
For over two decades, MountainView Risk & Analytics, A SitusAMC company, has helped clients accurately forecast outcomes and make balance-sheet decisions through an integrated methodology and advanced statistical modeling that incorporates a multi-layered, institution-specific analysis. We assist clients in developing credit risk, model risk and enterprise risk strategies and infrastructures to achieve optimal profits, as well as assessing and quantifying the various risks embedded within the organization. Our team collaborates with clients and provides insights and best practices from engagements across the country, bringing this knowledge to bear on every assignment to assist clients in their business needs. If you would like to learn more about working with MVRA please submit a request to connect today!